California Golf Course
- Water Conservation on Golf Course Fairways & Landscapes Using Aquaboost
- Introduction
- Results and Discussion
- Water conservation experiments
- Volumetric Moisture Content
- Turf Color and Quality
- Normalized Deviation Vegetation Index (NDVI)
- 100% ETo
- Turf Color
- Turf Quality
- Normalized Difference Vegetative Index (NDVI)
- Red/NIR
- Volumetric Moisture Quality (VMC)
- 75% ETo
- Turf color
- Turf Quality
- Normalized Difference Vegetative Index (NDVI)
- RED/NIR
- Volumetric Moisture Content (VMC)
- 67% ETo
Water Conservation on Golf Course Fairways & Landscapes Using Aquaboost

Sowmya Mitra, Ph.D., Abraham Chavez, and Marvin Seaman
Department of Plant Sciences & Technology
California State Polytechnic University, Pomona
California, 91709
(909) 869-2989
October 18, 2009
CAL POLY POMONA
Introduction
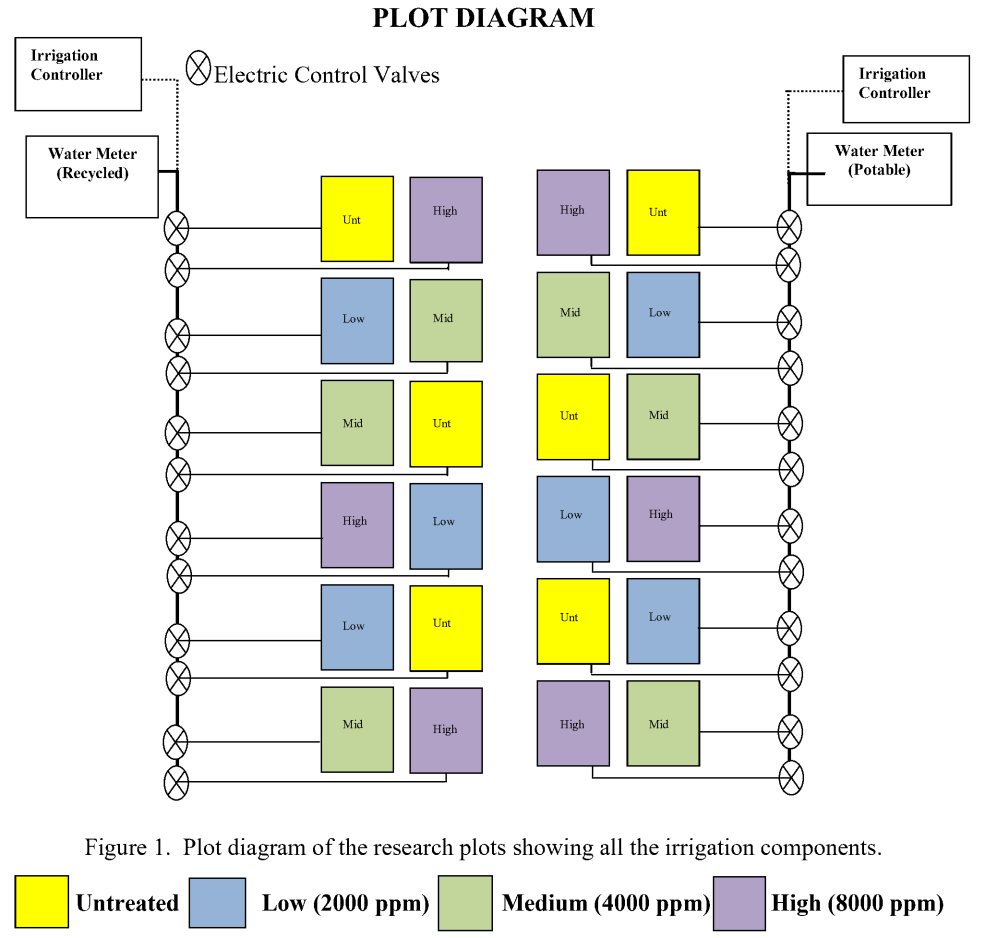
The experiments were conducted at the Center for Turf Irrigation and Landscape Technology (C-TILT), California State Polytechnic University, Pomona. The plots were laid out in a split plot design with three replicates where the main factor was the different Aquaboost treatments and the sub factor was the irrigation water quality (recycled and potable). Each individual plot was 10ft by 10 ft in dimension (Figure 1).
The following treatments were included in the trial;
- Control
- Aquaboost low rate (2000 ppm)
- Aquaboost mid rate (4000 ppm)
- Aquaboost high rate (8000 ppm)
Results and Discussion
Water conservation experiments
During a period of 5 months the amount of irrigation was slowly reduced to observe the effects of Aquaboost in maintaining turf quality under reduced irrigation regimes. In the month of May the irrigation system was set to 100% of the ETo replacement values. In the month of June the amount of irrigation water was reduced by 25% (75% ETo) followed by 33% reduction (67% ETo) in July, 50% reduction in August (50% ETo) and finally it was reduced to 75% reduction (25% ETo) in September. The data from the recycled and potable water experiments were combined as an overall average for the water conservation experiments. The plot layout for the experiments is shown below (Photo 1).
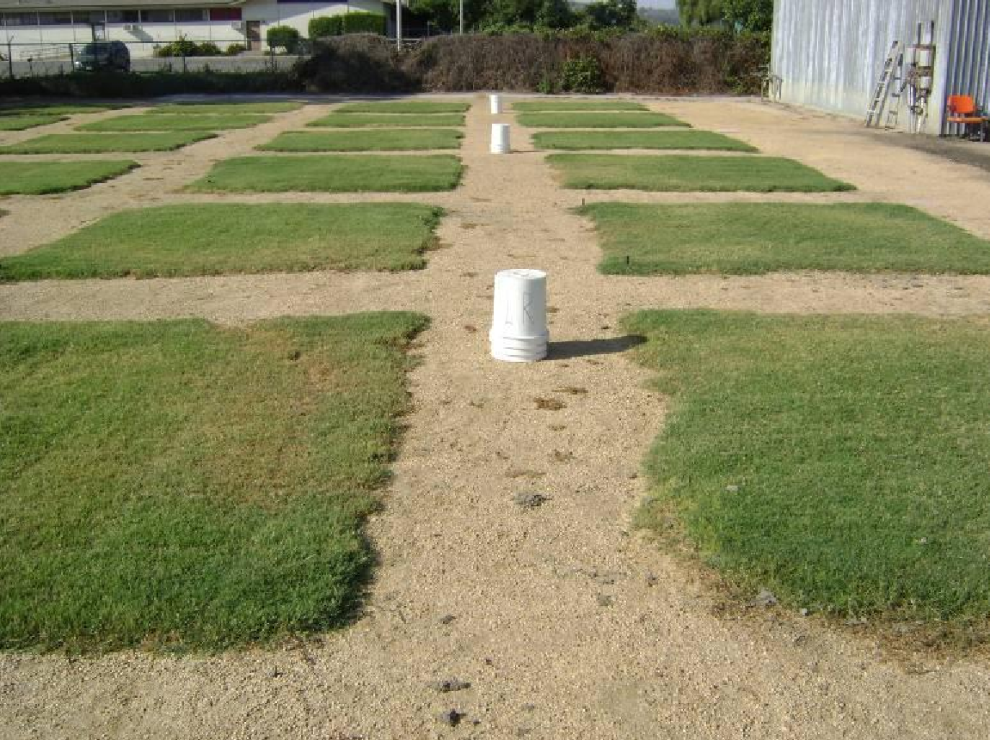
Photo 1. Layout of plots in the month of August 2009 when the plots received 50% of the ETo replacement values through irrigation.
Volumetric Moisture Content
The volumetric moisture content (VMC) reduced as the amount of irrigation reduced from 100% ETo to 75%, 67%, 50% and finally 25% ETo. The application of Aquaboost at all the three rates resulted in higher VMC but the difference was not significant at the 100% and 75% ETo levels. As the moisture stress increased the addition of the Aquaboost resulted in higher VMC in the soil. The difference in VMC between the Aquaboost rates was significant at the 67% and 50% ETo levels. There was no difference in VMC between the different rates of Aquaboost at the 25% ETo level (Figure 1).
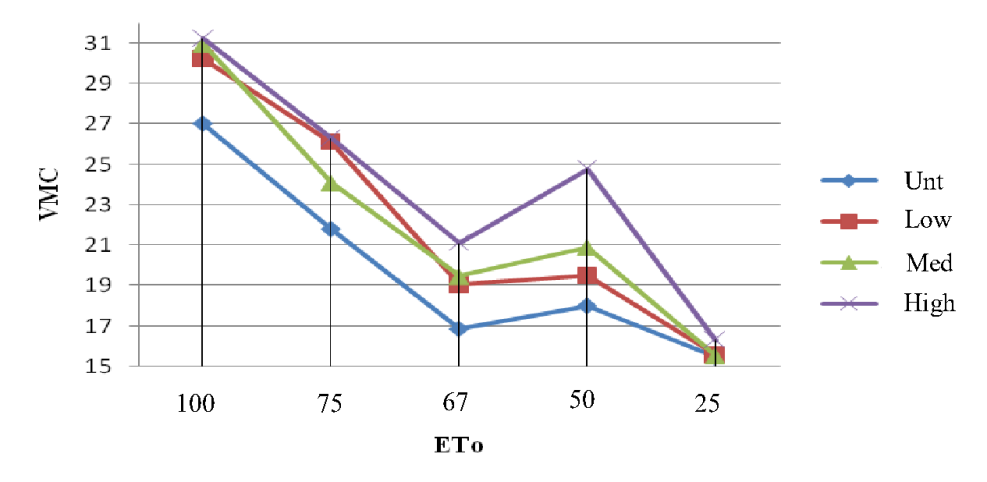
Figure 1. Overall mean volumetric moisture content (VMC) as affected by the addition of Aquaboost under different irrigation regimes.
Turf Color and Quality
Addition of the Aquaboost helped in improving turf color and quality throughout the experiment. The turf color was highest when the highest rate of Aquaboost was applied. There was no difference between the medium and the low rate of the Aquaboost treatments (Figure 2).
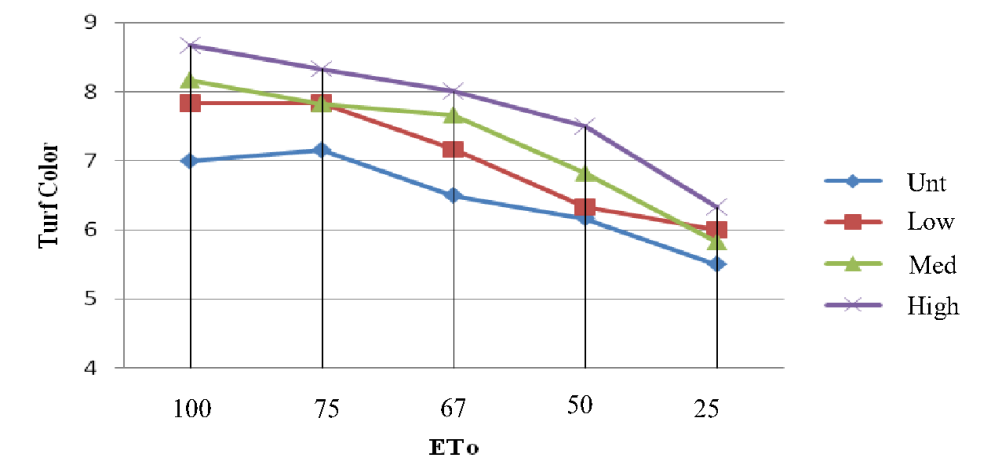
Figure 2. Overall mean turf color of the plots as affected by the addition of Aquaboost under different irrigation regimes.
Overall the turf quality improved with the addition of Aquaboost throughout the water conservation part of the experiment. The turf quality declined as the amount of irrigation water was reduced. There was no difference in turf quality between the low and medium rate of Aquaboost treatments. The highest rate of Aquaboost resulted in highest turf quality throughout the experiment (Figure 3). The turf quality was adversely affected when the irrigation water was reduced to 25% of the ETo even with the Aquaboost treatments. Hence, based on these results a reduction of 25% to 50% of the irrigation water based on ETo replacement values could be achieved with Aquaboost in a heavy soil where the experiment was conducted. In light textured soils the percentage reduction of irrigation water with Aquaboost will be lower than observed in the experiments since the soil was a heavy clay loam soil with a higher water holding capacity.
Normalized Deviation Vegetation Index (NDVI)
The health, growth, and development of turf was monitored with a Greenseeker (N Tech Instruments, Ukiah, CA). The Greenseeker sends light from a source and records the reflectance from the turf canopy. Monitoring the reflectance in the near infrared (NIR) and red (R) wavelengths allows the determination of turfgrass quality and detection of early water stress (Park et al., 2005). The characteristics of healthy, live, green vegetation are that it has a low reflectance of light from the visual spectrum (R) as a result of the leaf pigments and has a high reflectance of NIR from the scattering of light in the leaf mesophyll cells (Park et al., 2005). On the other hand, dead, brown vegetation and the soil have the reflectance that increases from the visible spectrum to NIR (Park et al., 2005). The normalized difference vegetative index (NDVI) is strongly correlated with plant biomass, leaf area index, canopy photosynthetic capacity, and chlorophyll production (Park et al., 2005). Hence healthy dense turf stand has a higher NDVI value and the ratio of R/NIR is lower than the values observed in thin unhealthy stand of turf.
The highest rate of Aquaboost resulted in higher NDVI compared to the other treatments but there was no significant difference between the other treatments (Figure 4). There was no significant difference between the treatments in regard to the ratio of the red/NIR values between the treatments (Figure 5). Though the combined mean of the potable and recycled water treatments did not show significant difference in the NDVI and red/NIR values but the individual treatments had significant difference when they were compared within the recycled and potable water irrigation treatments.
100% ETo
During the month of May 2009 the irrigation system was set to deliver 100% of the ETo replacement. Overall the addition of Aquaboost did not affect turf growth and development when there was adequate irrigation water. The difference between the treatments was observed under moisture stress.
Turf Color
The plots were rated for turf color on a scale of 1-10 where 1 = brown dead turf and 10 = lush green color. A reading of 6.0 was considered as an acceptable turf color.
Recycled Water
All the plots which received Aquaboost had higher turf color compared to the untreated plots. There was no statistical difference between the three rates of Aquaboost in the recycled water irrigated plots under the 100% ETo irrigation regime (Figure 6).
Potable Water
The was no difference in turf color between the different rates of Aquaboost and the untreated control treatment when the plots were irrigated with potable water under the 100% ETo irrigation regime. Hence, no benefit of adding Aquaboost was observed when there was more than adequate moisture in the soil.
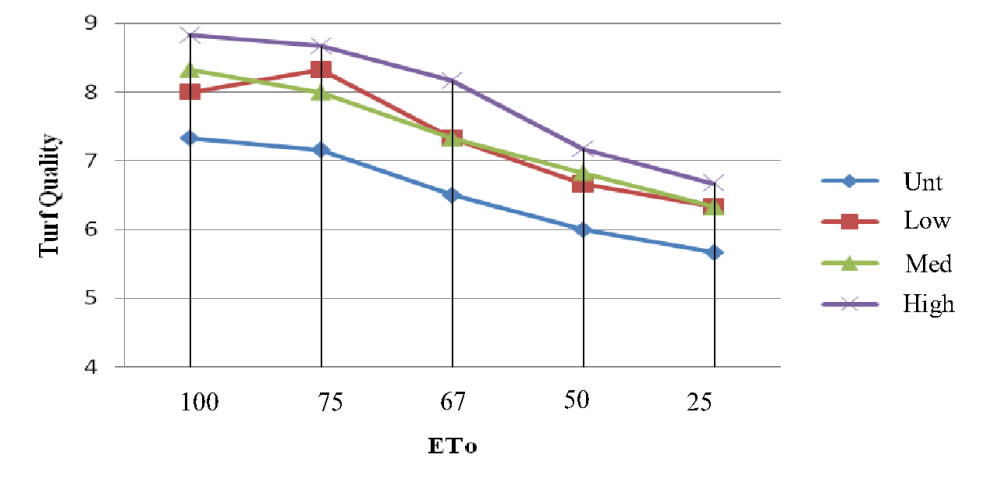
Figure 3. Overall mean turf quality of the plots as affected by the addition of Aquaboost under different irrigation regimes.
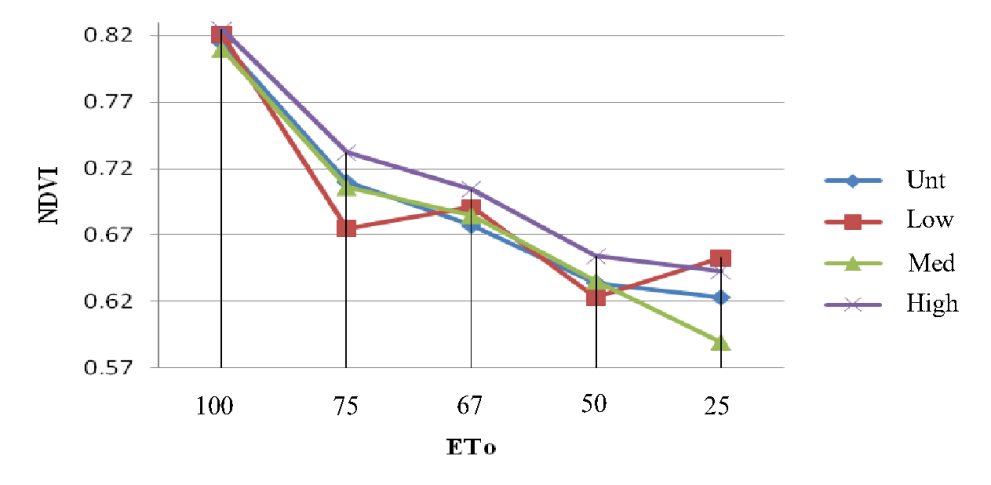
Figure 4. Overall mean normalized deviation vegetation index (NDVI) of the plots as affected by the addition of Aquaboost under different irrigation regimes.
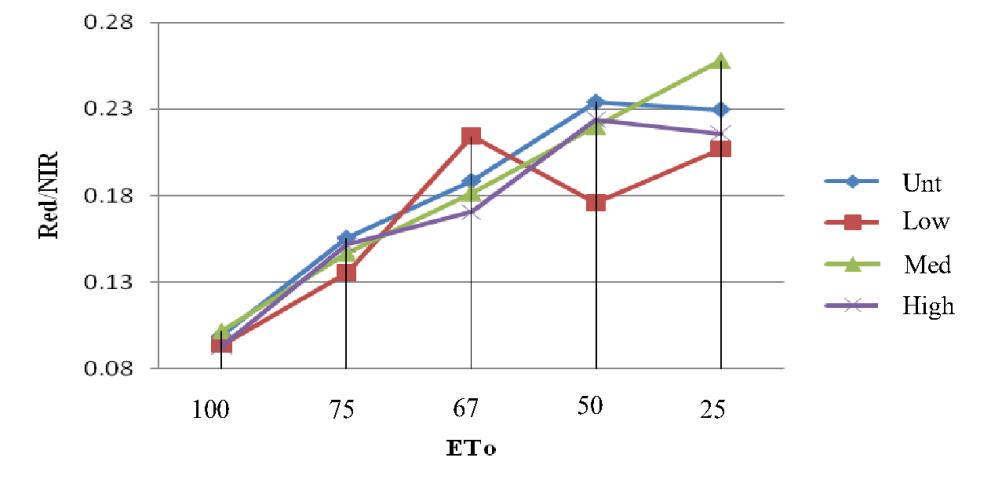
Figure 5. Overall ratio of Red/NIR values of the plots as affected by the addition of Aquaboost under different irrigation regimes.
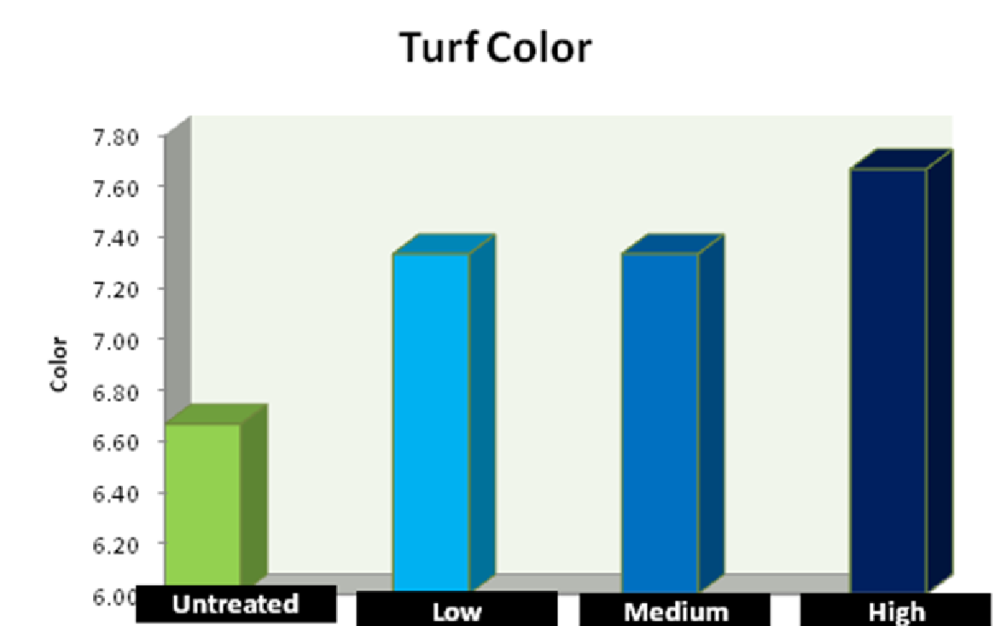
Figure 6. Turf color in the plots irrigated with recycled irrigation water throughout the experiment. The plots were visually rated on a scale of 1-10, where 1 = brown dead turf and 10 = lush green color.
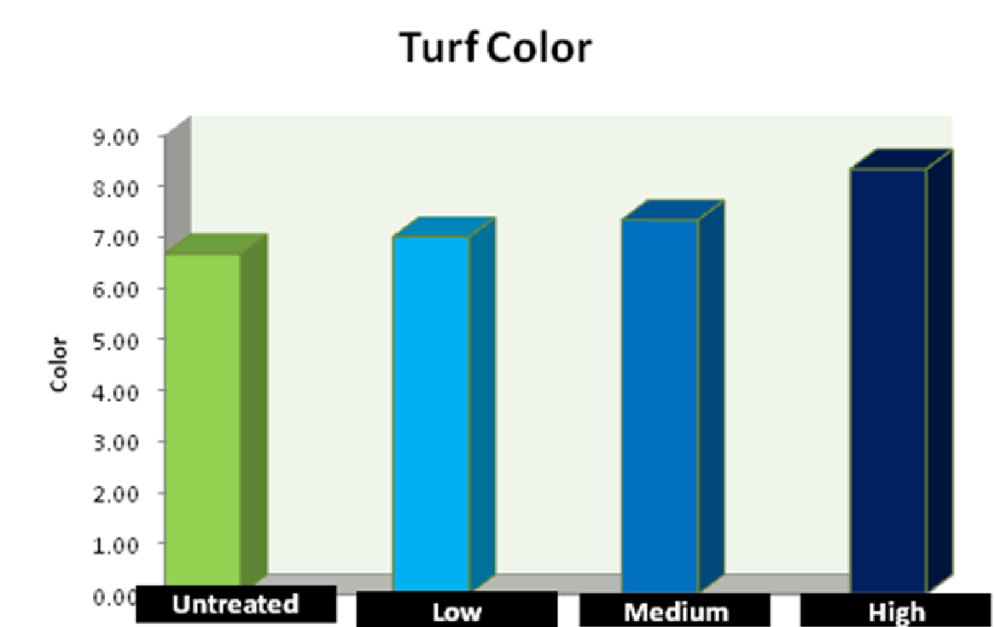
Figure 7. Turf color in the plots irrigated with potable irrigation water throughout the experiment. The plots were visually rated on a scale of 1-10, where 1 = brown dead turf and 10 = lush green color.
Turf Quality
The visual quality ratings was conducted on a scale from 1-10 where 1 = thin stand while 10 = dense thick stand of turf. A reading of 6.0 was considered as an acceptable turf quality.
Recycled water
The addition of Aquaboost resulted in higher turf quality compared to the untreated plots. There was no significant difference in turf quality between the low mid and high rate of Aquaboost treatment.
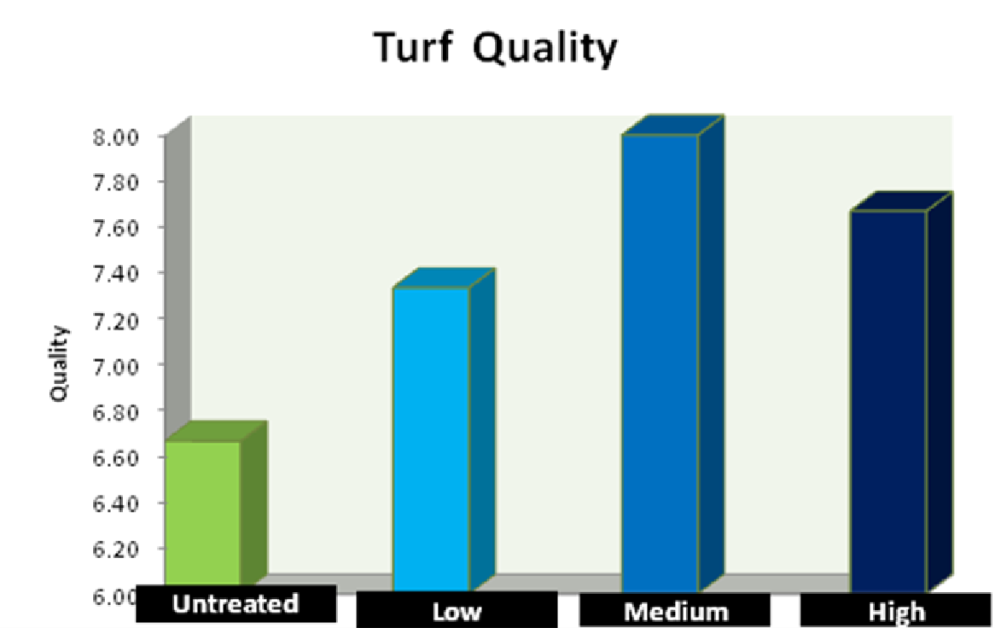
Figure 8. Overall turf quality of the plots irrigated with recycled irrigation water. The plots were visually rated on a scale of 1-10, where 1 = brown dead turf and 10 = lush green color.
Potable Water
The turf quality was higher in the mid and high rate of Aquaboost compared to the untreated and the low rate of Aquaboost treatments.
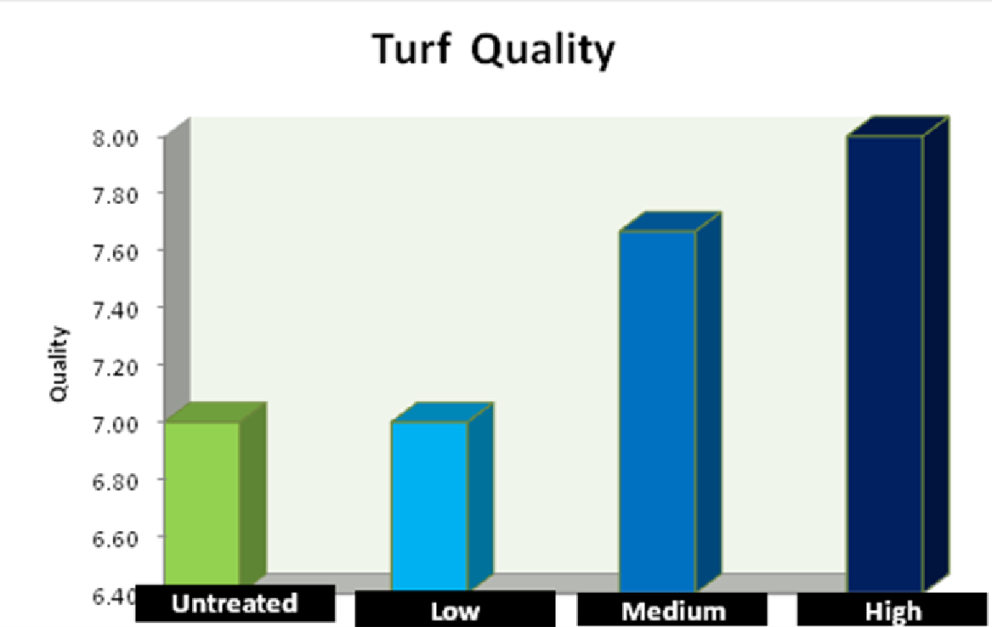
Figure 9. Overall turf quality of the plots irrigated with potable irrigation water. The plots were visually rated on a scale of 1-10, where 1 = brown dead turf and 10 = lush green color.
Normalized Difference Vegetative Index (NDVI)
The health, growth and development of turf can be monitored using an instrument called the Greenseeker. The normalized difference vegetative index (NDVI) is strongly correlated with plant biomass, leaf area index, canopy photosynthetic capacity and chlorophyll production (Park et al. al., 2005). Hence healthy dense turf stand has a higher NDVI value and the ratio of R/NIR is lower than the values observed in thin unhealthy stand of turf.
Recycled Water
The highest normalized difference vegetative index (NDVI) was observed in the highest rate of Aquaboost followed by the medium and the low rate.
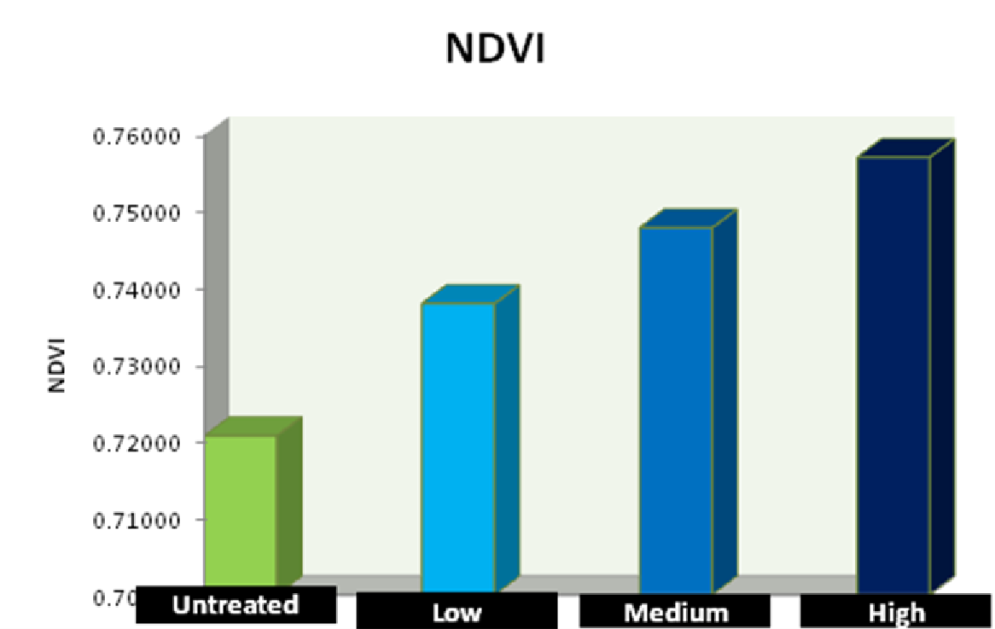
Figure 10. Overall normalized difference vegetation index (NDVI) of the plots irrigated with recycled irrigation water.
Potable Water
The difference between the treatments was highly significant in the plots irrigated with potable water. Highest NDVI was observed in the highest rate of Aquaboost treatment followed by the medium and low rates of Aquaboost.
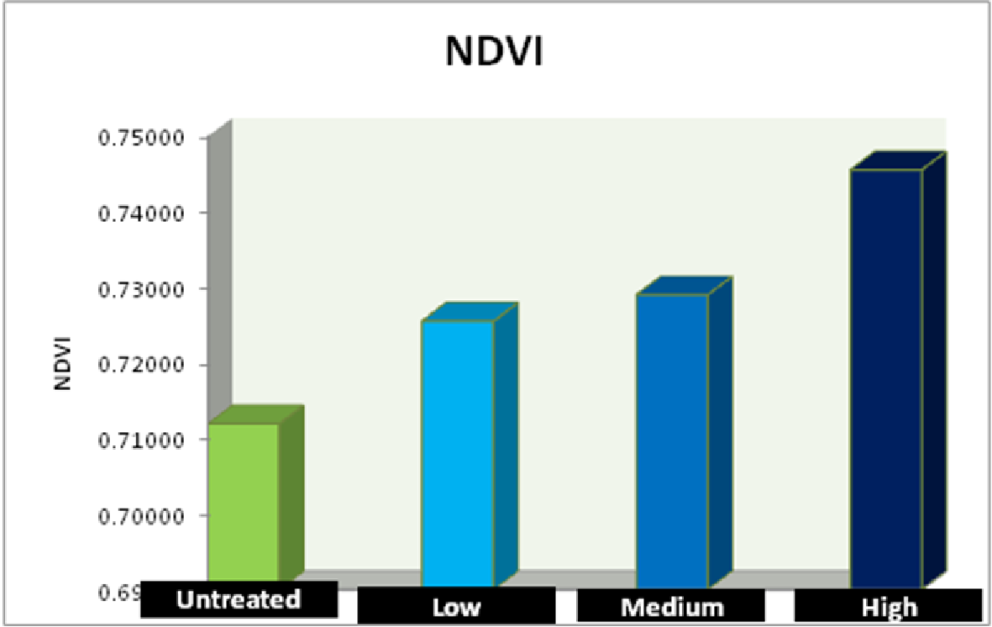
Figure 11. Overall NDVI of the plots irrigated with potable irrigation water.
Red/NIR
A healthy dense turf stand has a higher NDVI value and the ratio of R/NIR is lower than the values observed in thin unhealthy stand of turf.
Recycled Water
The difference in Red/NIR was significant for the treatments in the plots irrigated with recycled water. The lowest Red/NIR ratio was observed in the highest Aquaboost treatment which indicated that the plots were least stressed. There was no difference between the mid and low rate of Aquaboost treatments.
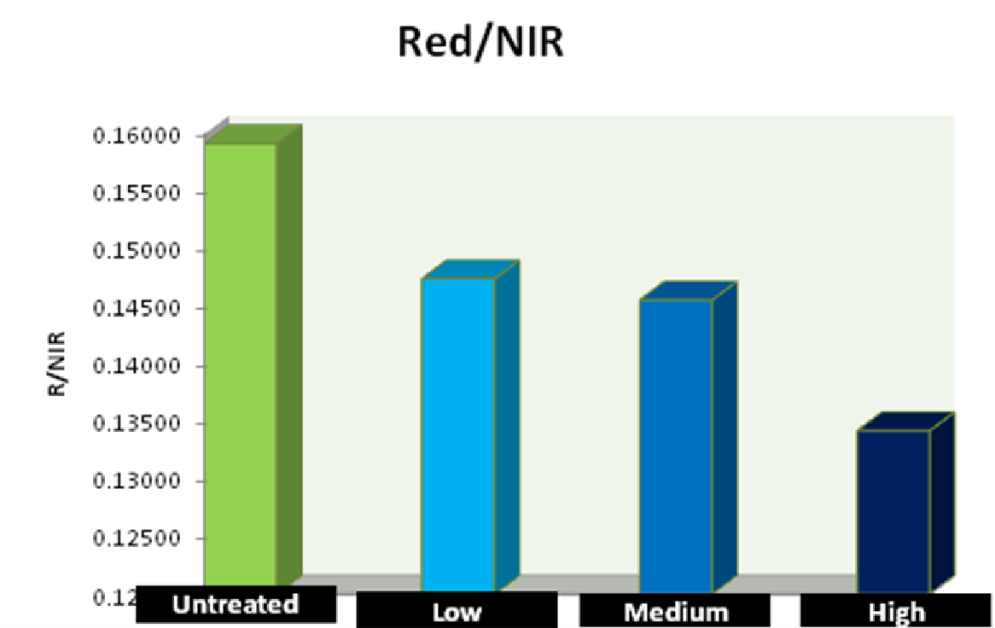
Figure 12. Overall red/near infra red (R/NIR) value for the plots irrigated with recycled water.
Potable Water
The difference in Red/NIR ratio between the treatments for the mid and low rates was not significant. The Red/NIR ratio was lowest in the highest Aquaboost treatment in the plots irrigated with potable water.
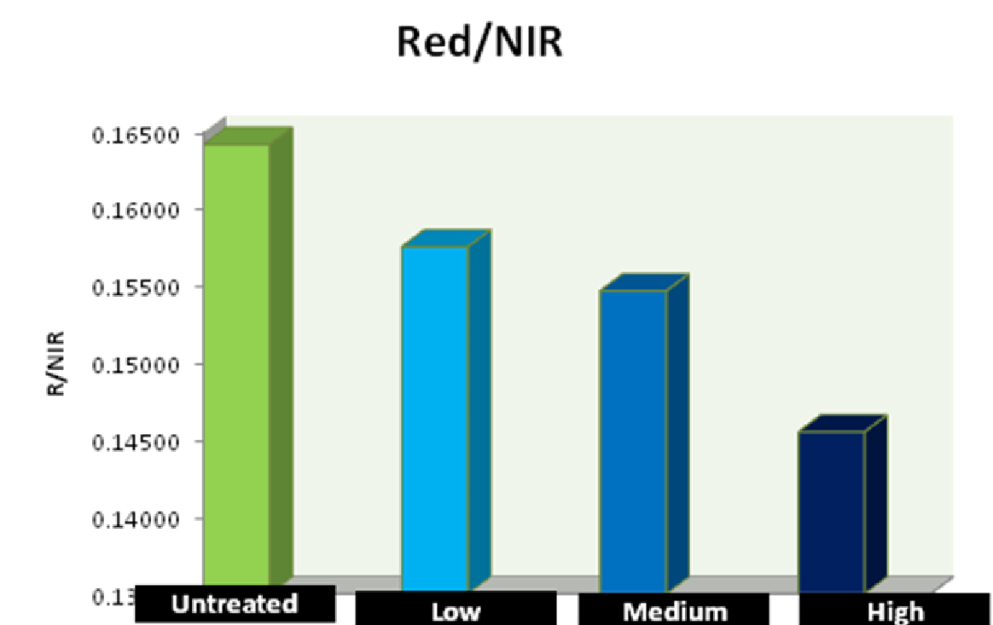
Figure 13. Overall Red/near infra red (R/NIR) value for the plots irrigated with potable water.
Greenseeker readings indicated that optimum turf health was observed when Aquaboost was injected at the highest rate of 8000 ppm into the irrigation lines every week on bermudagrass.
Volumetric Moisture Quality (VMC)
Recycled Water
The volumetric moisture content (VMC) at 4 inches under the soil surface indicated that the highest moisture was observed in the medium rate of Aquaboost treatment followed by the high and the low rate.
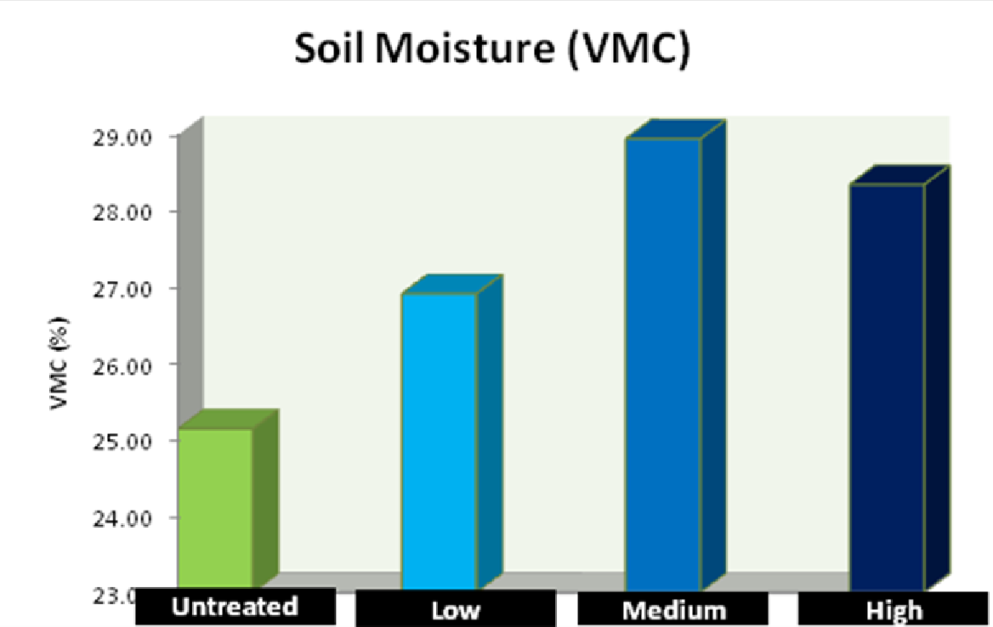
Figure 14. Overall volumetric soil moisture content (VMC) for the treatments irrigated with recycled water.
Potable Water
The difference in VMC between the treatments was lower in the potable water irrigated plots compared to the recycled water irrigated plots. Highest VMC was observed in the highest rate of Aquaboost treatment but there was no difference between the mid and the low rate of Aquaboost treatments.
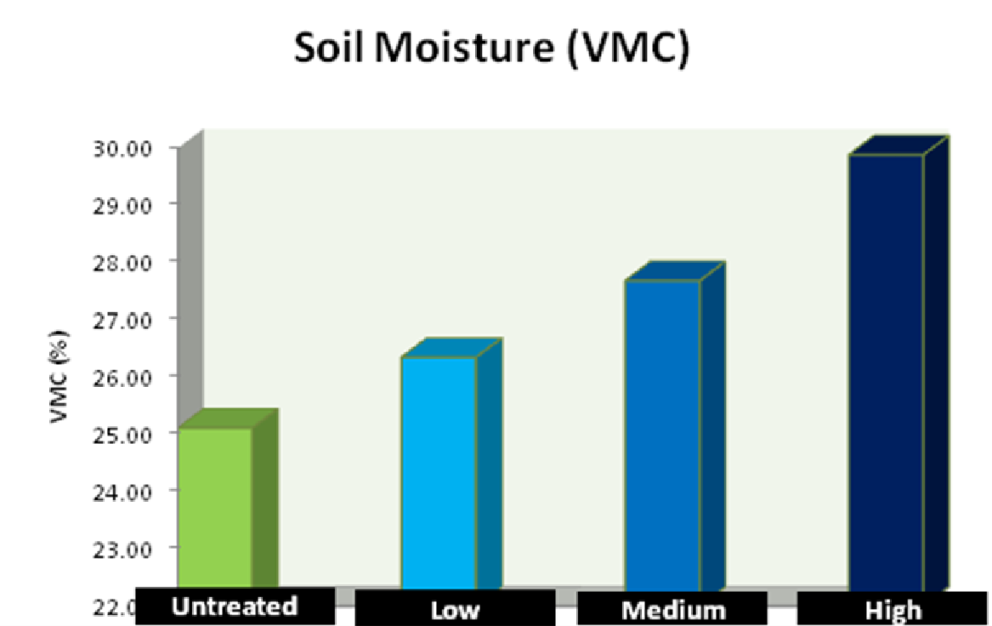
Figure 15. Overall volumetric soil moisture content (VMC) for the treatments irrigated with potable water.
75% ETo
During the month of June 2009 the irrigation system was set to deliver 75% of the ETo replacement values. Hence these treatments were actually saving 25% of the irrigation water in respect to the ETo replacement values. Taking the crop coefficient of bermudagrass as 0.75 this irrigation regime was the optimum amount of irrigation that should be applied to bermudagrass maintained under southern California growing conditions.
ETc = Crop coefficient x ETo
Turf color
Recycled Water
All the plots which received Aquaboost had higher turf color compared to the untreated plots. There was no difference between the three rates of Aquaboost applied in the recycled water irrigated plots under the 75 % ETo irrigation regime (Figure 16).
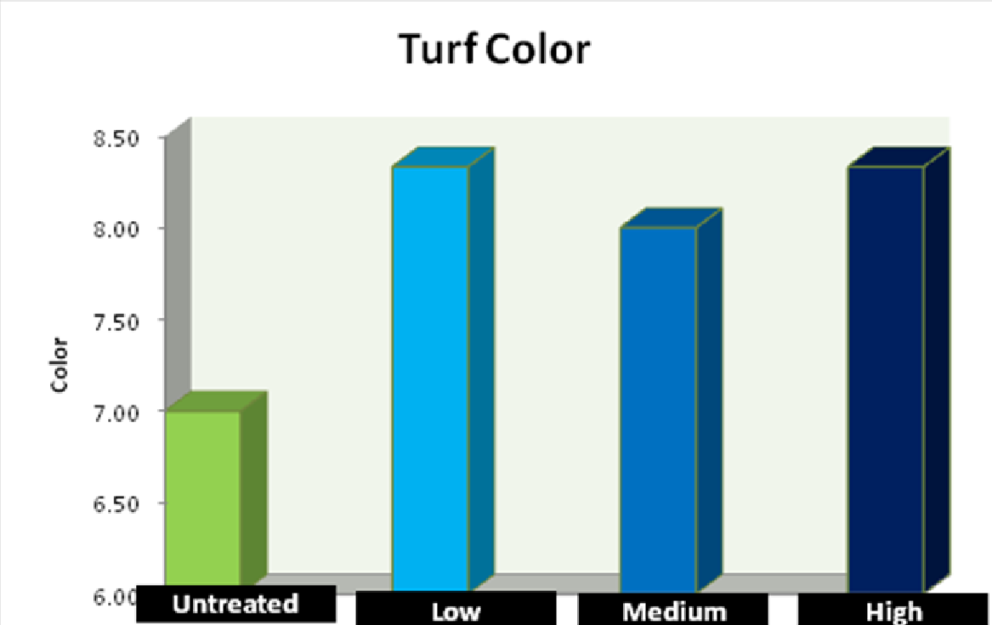
Figure 16. Overall turf color for the treatments irrigated with recycled water.
Potable Water
The highest rate of Aquaboost had higher turf color compared to the other treatments. There was no difference in turf color between the low and the medium rate of Aquaboost treatments.
Turf Quality
Recycled water
The addition of Aquaboost resulted in higher turf quality compared to the untreated plots. There was no significant difference in turf quality between the low, medium and high rate of Aquaboost treatment.
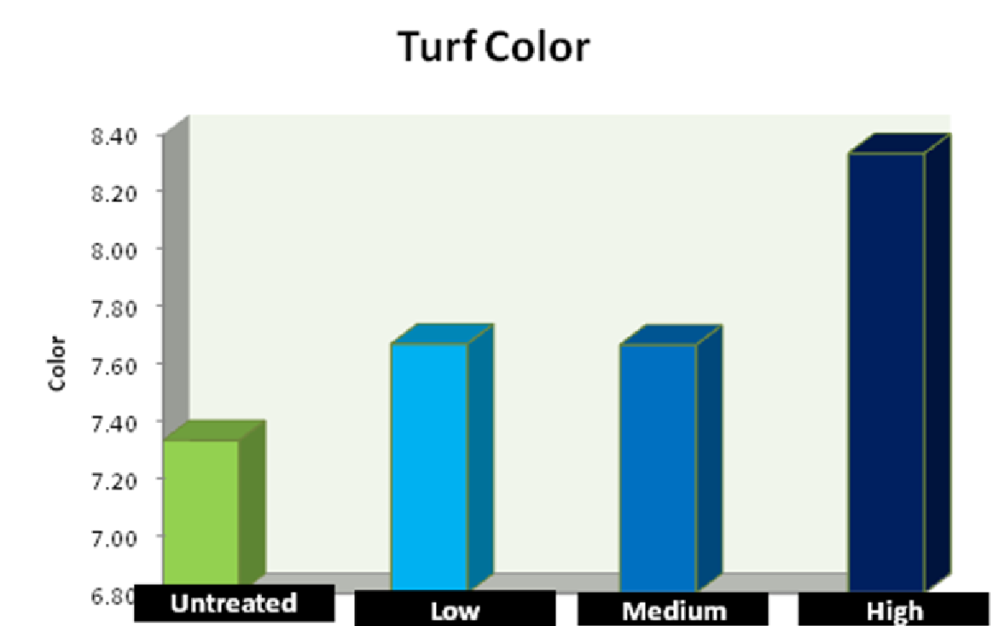
Figure 17. Turf color in the plots irrigated with potable irrigation water throughout the experiment. The plots were visually rated on a scale of 1-10, where 1 = brown dead turf and 10 = lush green color.
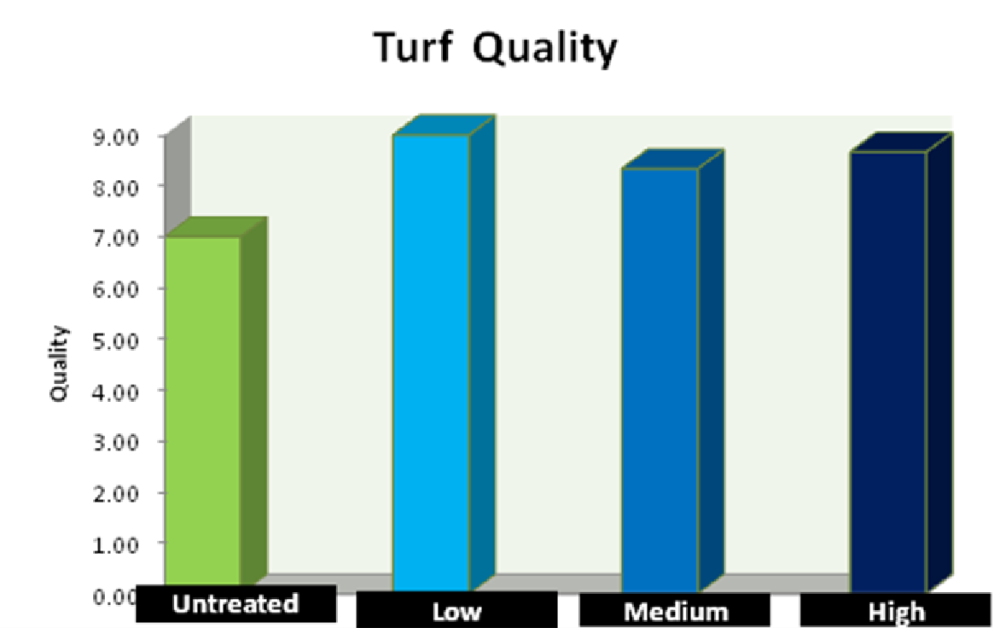
Figure 18. Overall turf quality of the plots irrigated with recycled irrigation water. The plots were visually rated on a scale of 1-10, where 1 = brown dead turf and 10 = lush green color.
Potable Water
The highest rate of Aquaboost had higher turf color compared to the other treatments. There was no difference in turf color between the low and the medium rate of Aquaboost treatments.
Normalized Difference Vegetative Index (NDVI)
Recycled Water
The highest normalized difference vegetative index (NDVI) was observed in the highest rate of Aquaboost followed by the medium and the low rate. There was no difference in NDVI between the low and the medium rate of Aquaboost.
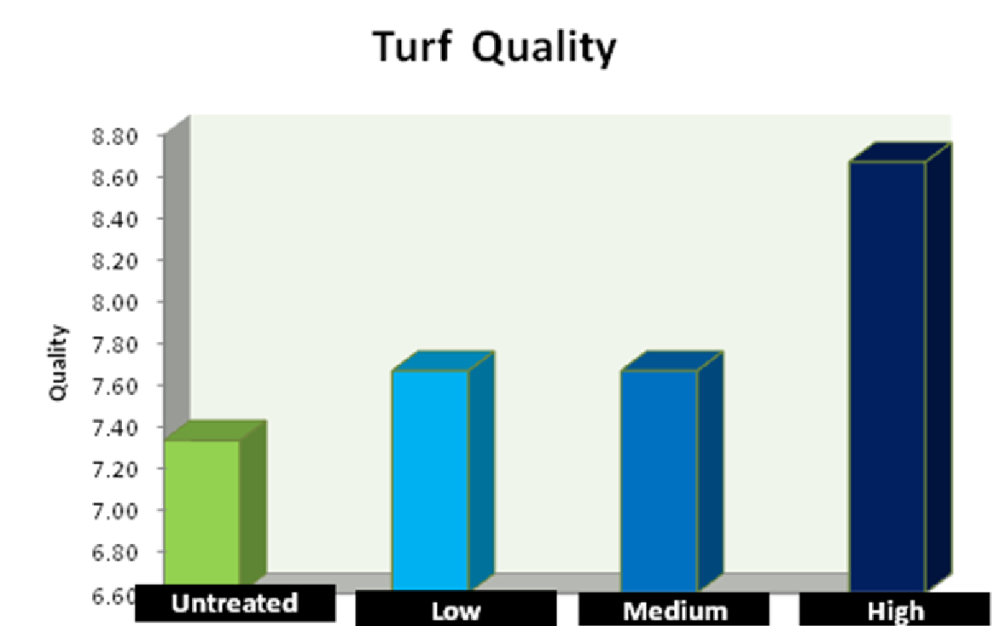
Figure 19. Overall turf quality of the plots irrigated with potable irrigation water. The plots were visually rated on a scale of 1-10, where 1 = brown dead turf and 10 = lush green color.
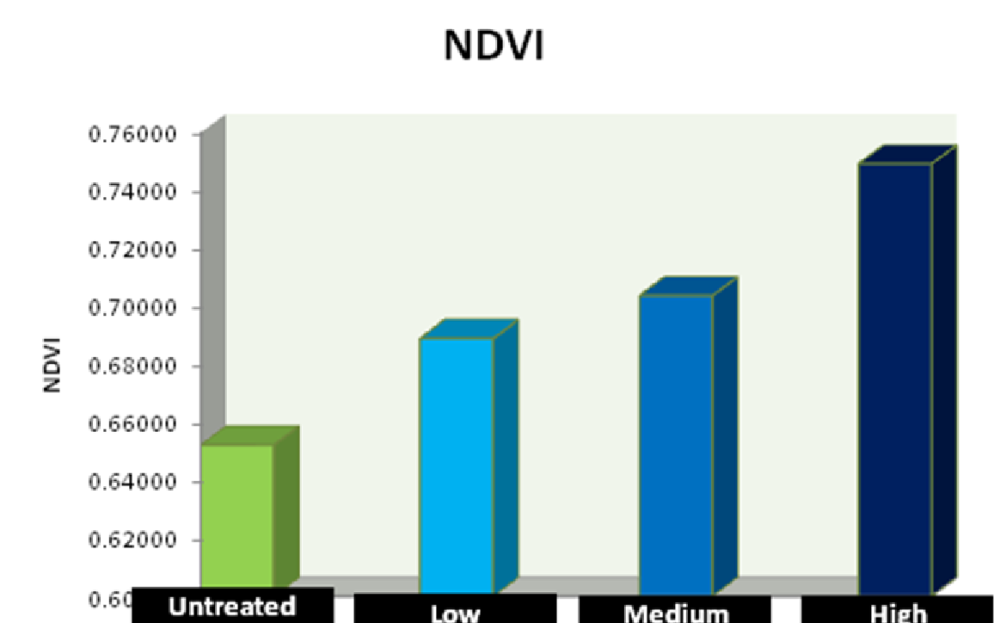
Figure 20. Overall normalized difference vegetation index (NDVI) of the plots irrigated with recycled irrigation water.
Potable Water
The difference between the treatments was highly significant in the plots irrigated with potable water. Highest NDVI was observed in the highest rate of Aquaboost treatment followed by the medium and low rates of Aquaboost. There was no difference between the medium and the high rates of Aquaboost treatments.
RED/NIR
Recycled Water
The difference in Red/NIR was not significant for the Aquaboost treatments in the plots irrigated with recycled water.
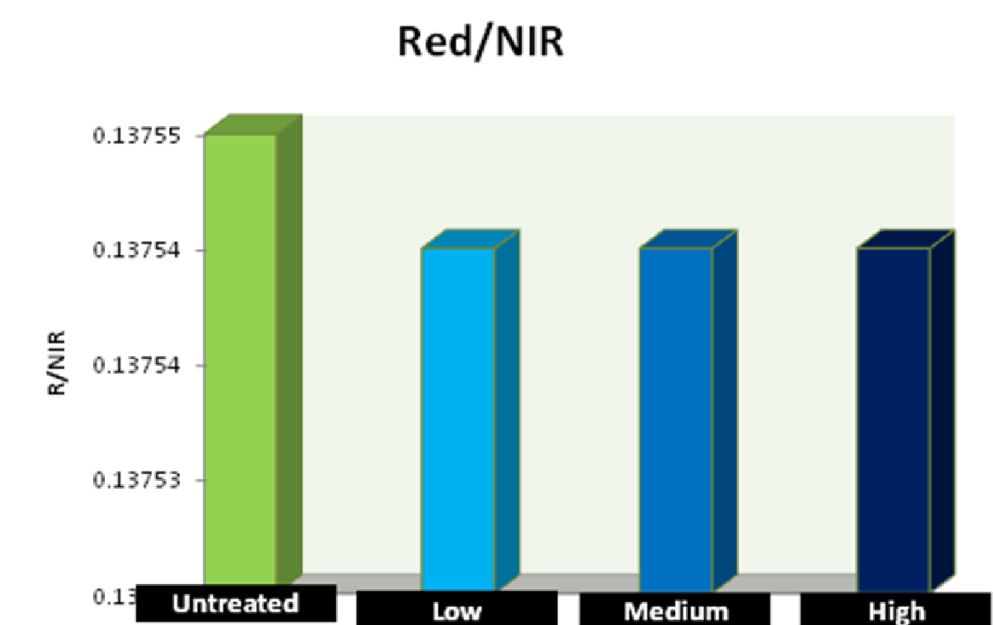
Figure 21. Overall NDVI of the plots irrigated with potable irrigation water.
Figure 22. Overall red/near infra red (R/NIR) value for the plots irrigated with recycled water.
Potable Water
The difference in Red/NIR ratio between the treatments for the high, mid and low rates was not significant.
Volumetric Moisture Content (VMC)
Recycled Water
The volumetric moisture content (VMC) at 4 inches under the soil surface indicated that there was no significant difference between the treatments.
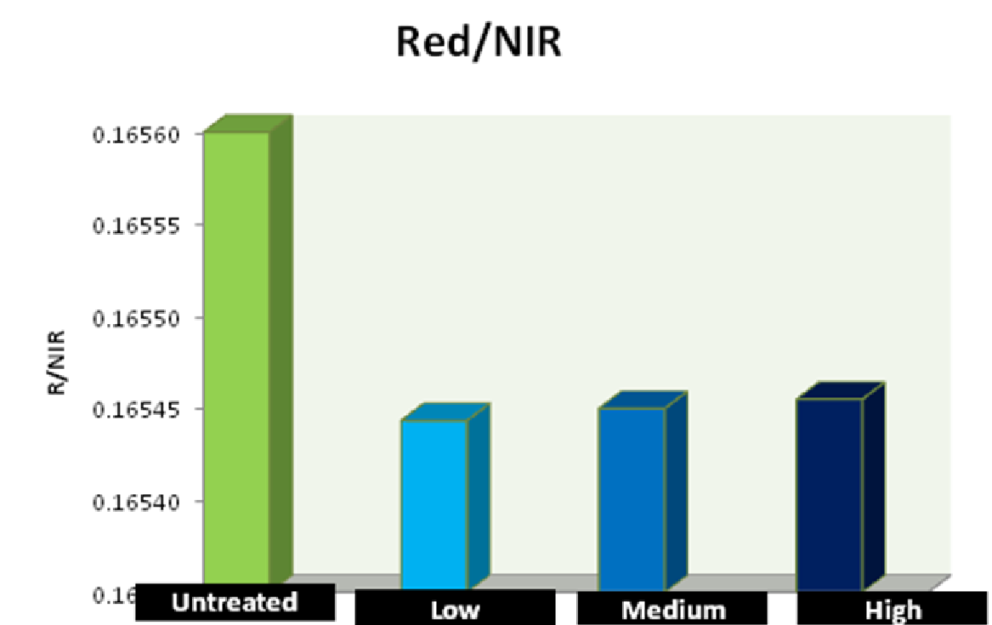
Figure 23. Overall red/near infra red (R/NIR) value for the plots irrigated with potable water.
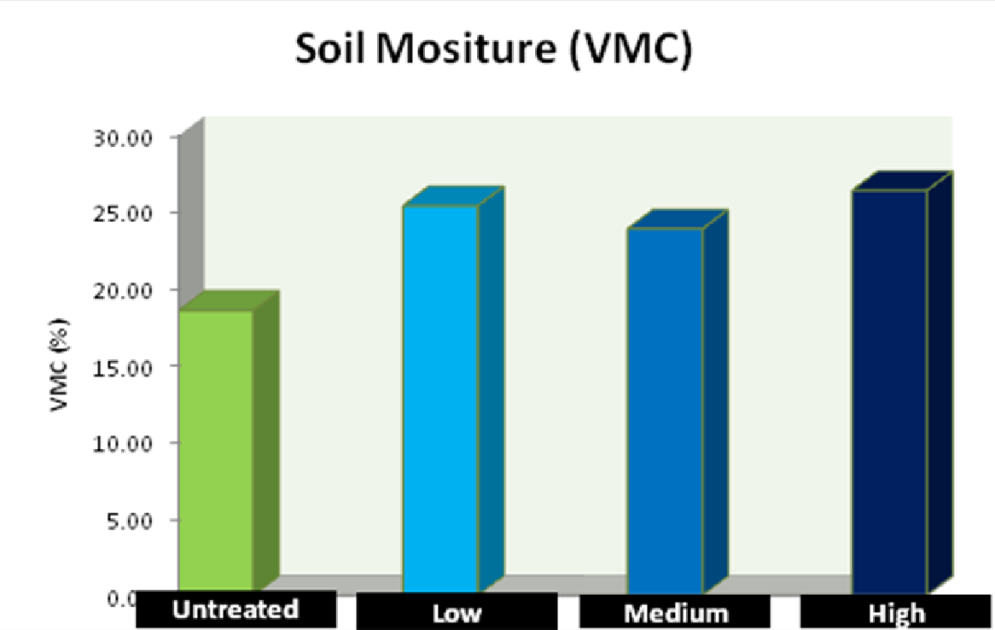
Figure 24. Overall volumetric soil moisture content (VMC) for the treatments irrigated with recycled water.
Potable Water
The difference in VMC between the treatments was not significant in the potable water irrigated plots.
67% ETo
During the month of August 2009 the irrigation system was set to deliver 67% of the ETo replacement value. Hence these treatments were actually saving 33% of the irrigation water in respect to the ETo replacement values.
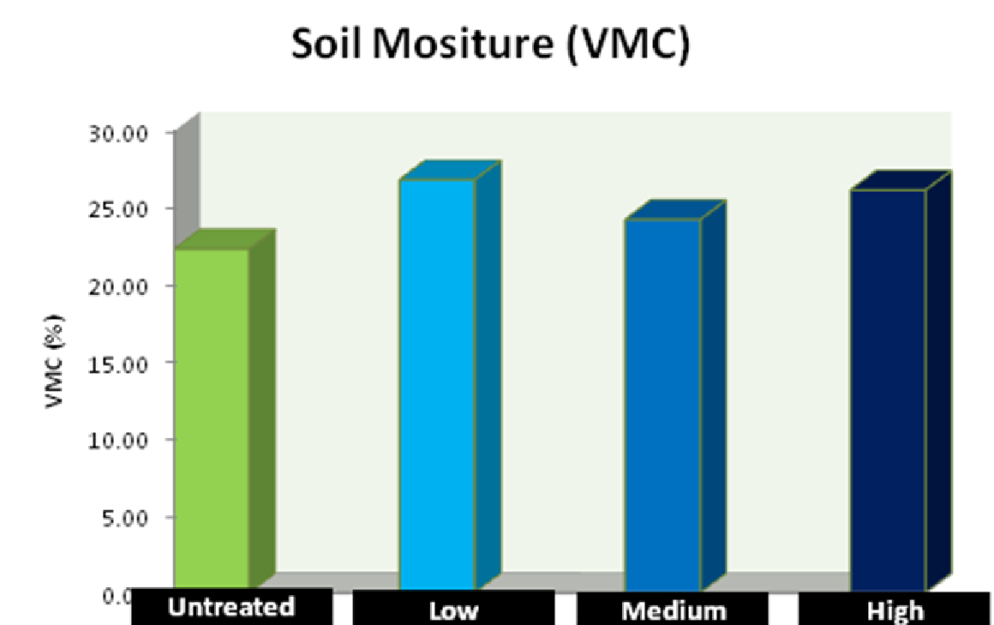
Figure 25. Overall volumetric soil moisture content (VMC) for the treatments irrigated with potable water.
Turf Color
Recycled Water
All the plots which received Aquaboost had higher turf color compared to the untreated plots. The highest turf color was recorded in the plots which had the high rate of Aquaboost applied in the plots irrigated with recycled water under the 67 % ETo irrigation regime (Figure 26).
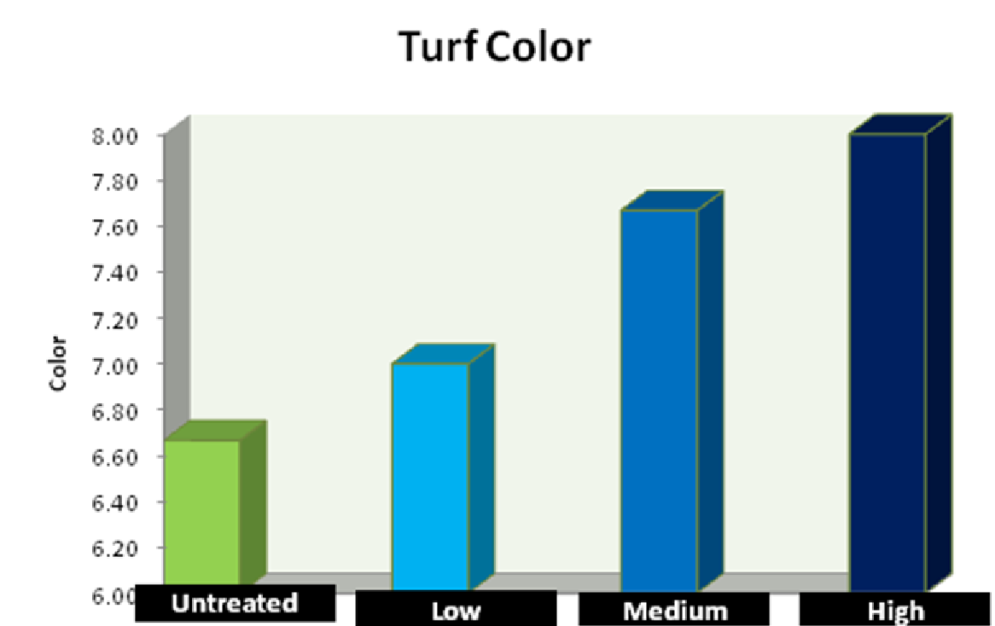
Figure 26. Overall turf color for the treatments irrigated with recycled water.
Potable Water
The was no difference in turf color between the different rates of Aquaboost and the untreated control treatment when the plots were irrigated with potable water under the 67% ETo irrigation regime.
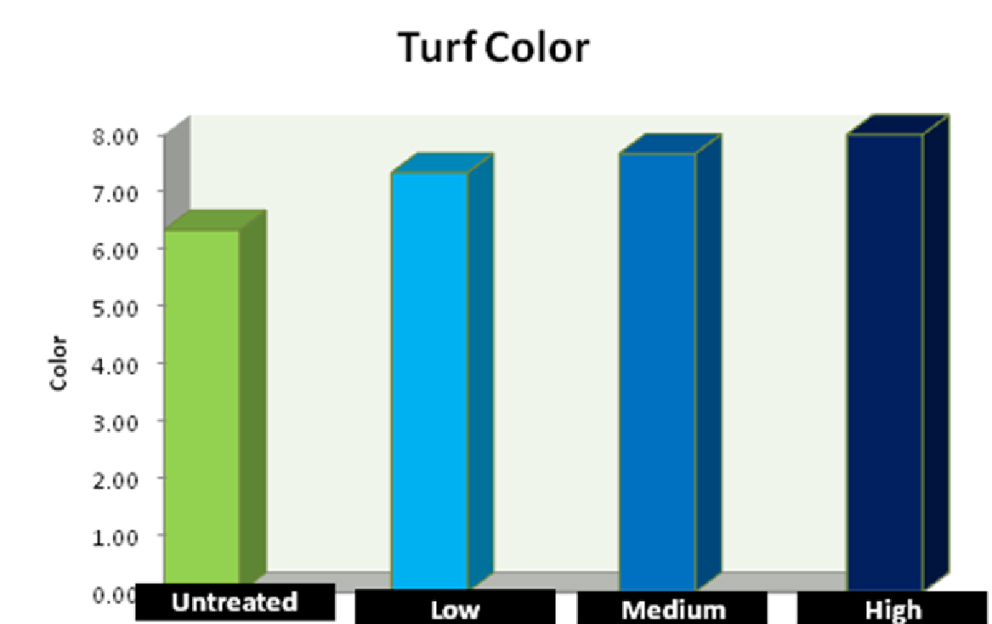
Figure 27. Turf color in the plots irrigated with potable irrigation water throughout the experiment. The plots were visually rated on a scale of 1-10, where 1 = brown dead turf and 10 = lush green color.
Turf quality
Recycled water
The addition of Aquaboost resulted in higher turf quality compared to the untreated plots. There was no significant difference in turf quality between the low, medium and high rate of Aquaboost treatment.
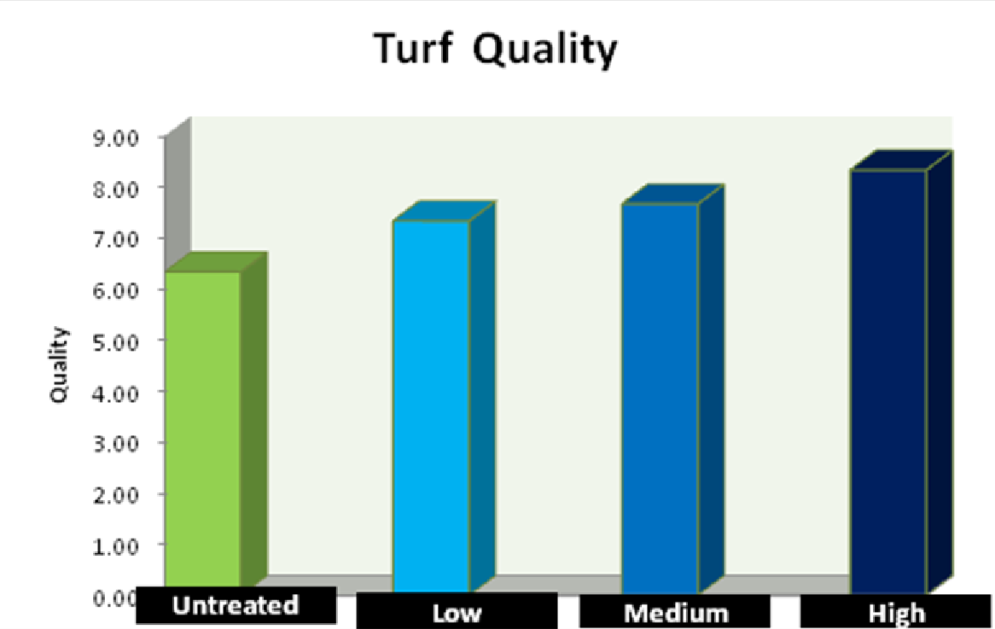
Figure 28. Turf quality in the plots irrigated with recycled irrigation water throughout the experiment. The plots were visually rated on a scale of 1-10, where 1 = brown dead turf and 10 = lush green color.
Potable Water
The highest rate of Aquaboost had higher turf quality compared to the other treatments. There was no difference in turf quality between the low and the medium rate of Aquaboost treatments.
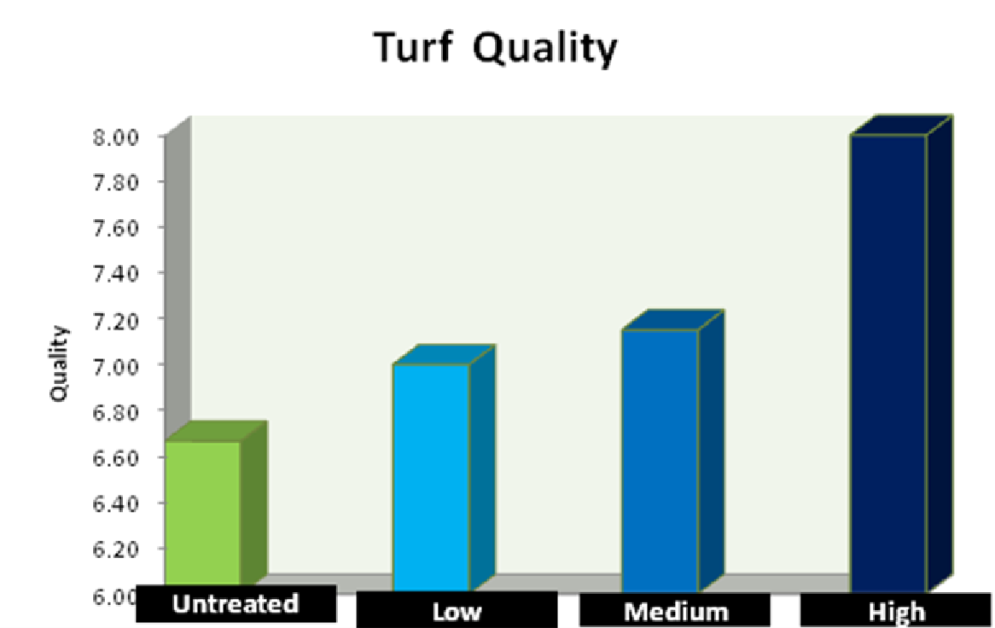
Figure 29. Overall turf quality of the plots irrigated with potable irrigation water. The plots were visually rated on a scale of 1-10, where 1 = brown dead turf and 10 = lush green color.
Normalized Difference Vegetative Index (NDVI)
Recycled Water
The highest normalized difference vegetative index (NDVI) was observed in the highest rate of Aquaboost followed by the medium and the low rate.
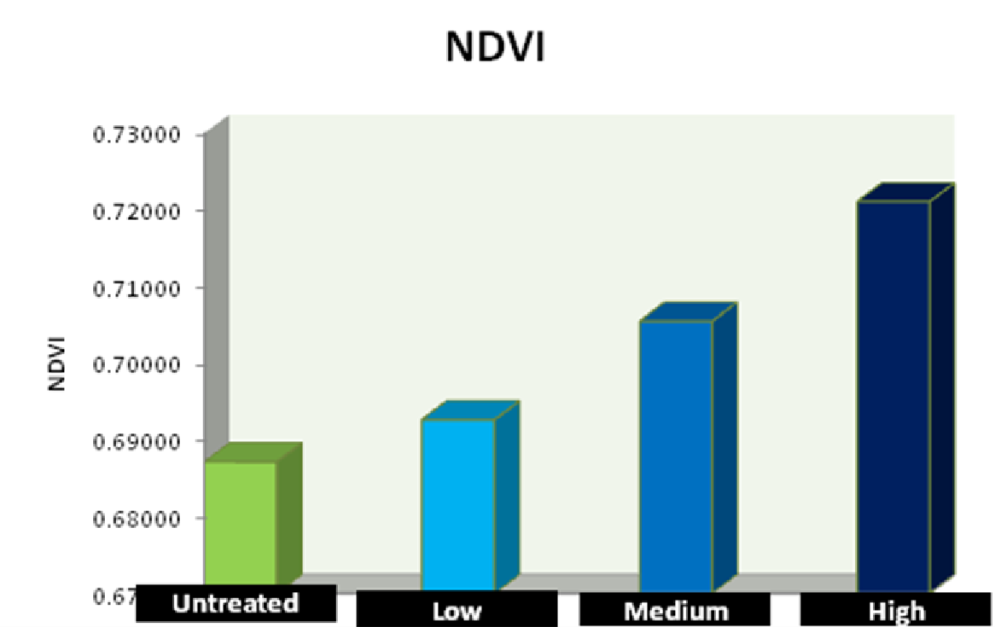
Figure 30. Overall normalized difference vegetation index (NDVI) of the plots irrigated with recycled irrigation water.
Potable Water
The difference between the treatments was highly significant in the plots irrigated with potable water. Highest NDVI was observed in the highest rate of Aquaboost treatment followed by the medium and low rates of Aquaboost. There was no difference between the medium and the high rates of Aquaboost treatments.
RED/NIR
Recycled Water
The difference between the treatments was highly significant in the plots irrigated with potable water. Lowest Red/NIR was observed in the highest rate of Aquaboost treatment followed by the medium and low rates of Aquaboost.
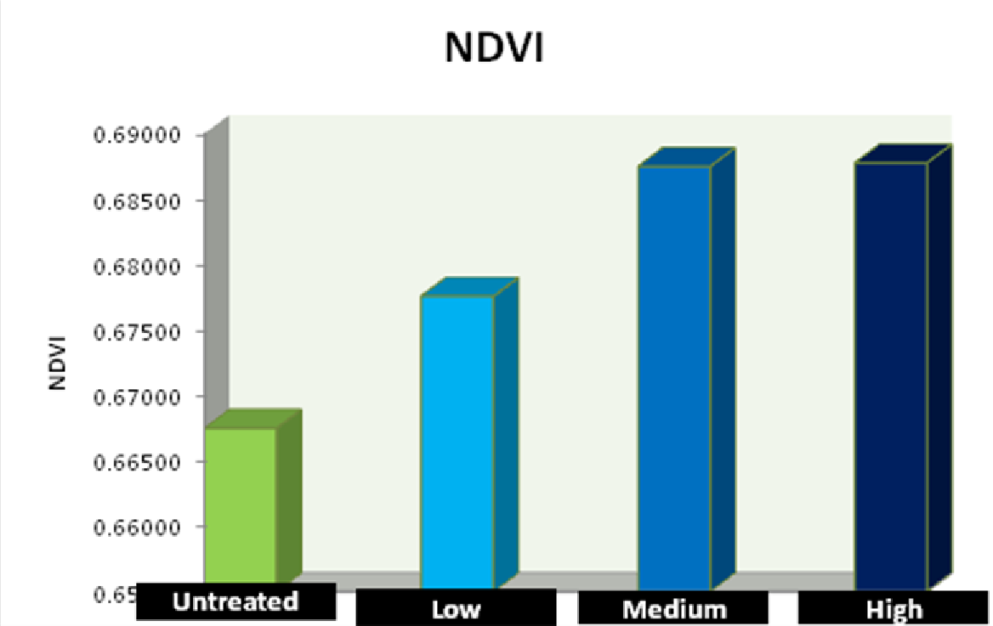
Figure 31. Overall NDVI of the plots irrigated with potable irrigation water.
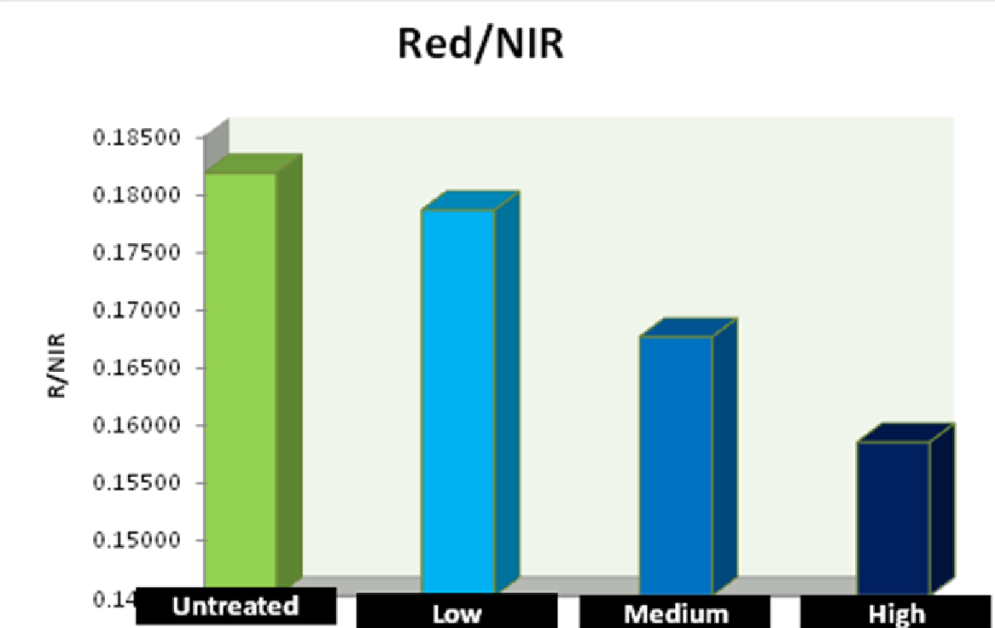
Figure 32. Overall red/near infra red (R/NIR) value for the plots irrigated with recycled water.
Potable Water
The Aquaboost treatments had lower Red/NIR ratio compared to the untreated plots which indicated less stress in the Aquaboost treated plots compared to the control plots. The difference in Red/NIR ratio between the different Aquaboost rate treatments was not significant.
Volumetric Moisutre Content (VMC)
Recycled Water
The volumetric moisture content (VMC) at 4 inches under the soil surface indicated that there was no significant difference between the treatments.
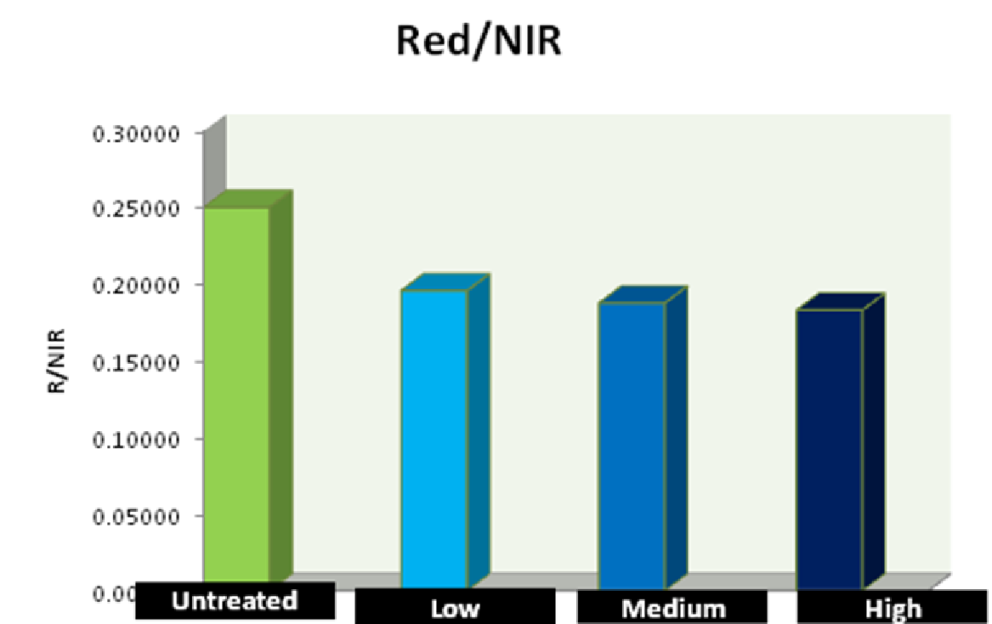
Figure 33. Overall red/near infra red (R/NIR) value for the plots irrigated with potable water.

Figure 34. Overall volumetric soil moisture content (VMC) for the treatments irrigated with recycled water.
Potable Water
The difference in VMC between the treatments was not significant in the potable water irrigated plots. Highest VMC was observed in the highest rate of Aquaboost treatment.
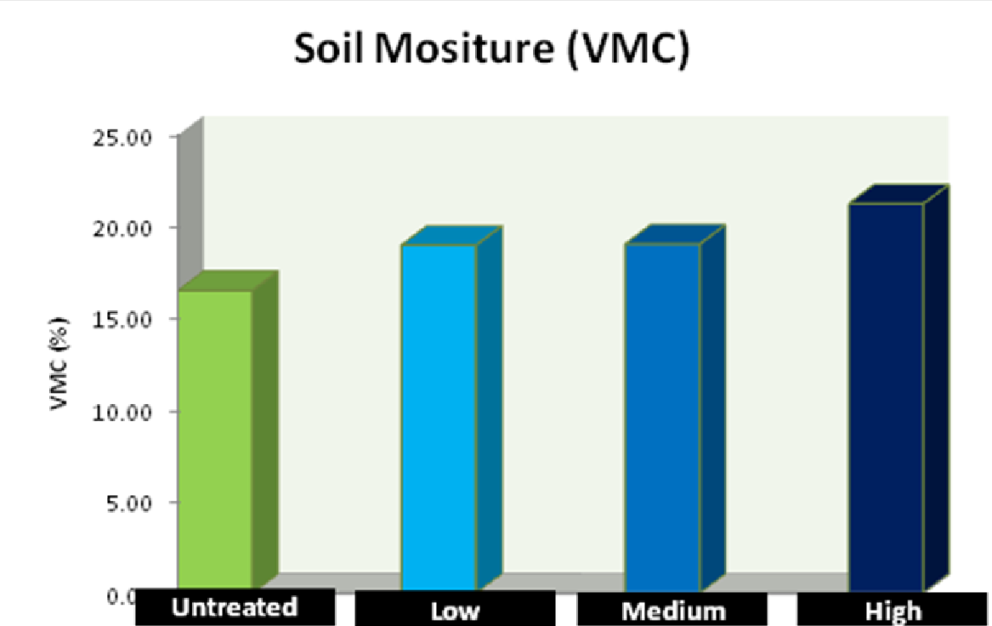
Figure 35. Overall volumetric soil moisture content (VMC) for the treatments irrigated with potable water.
50% ETo
During the month of September 2009 the irrigation system was set to deliver 50% of the ETo replacement. Hence these treatments were actually saving 50% of the irrigation water in respect to the ETo replacement values. Taking the crop coefficient of bermudagrass as 0.75 for southern California the irrigation regime with 75% ETo was the optimum amount of irrigation that should be applied to bermudagrass maintained under southern California growing conditions. So compared to the optimum irrigation regime the 50% ETo was actually 25% water conservation treatments compared to the optimum irrigation regime.
Turf Color
Recycled Water
All the plots which received the highest rate of Aquaboost had higher turf color compared to the untreated plots. There was no difference in turf color between the low and medium rate of Aquaboost treatments (Figure 36).
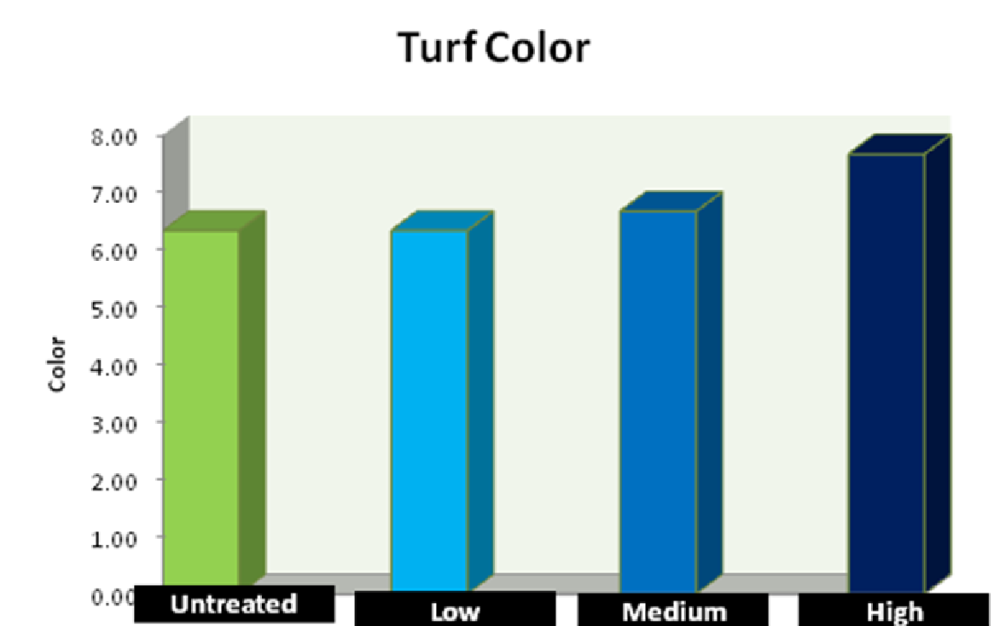
Figure 36. Overall turf color for the treatments irrigated with recycled water.
Potable Water
Turf color was higher in the highest rate of Aquaboost treatment compared to the low and untreated plots. There was no difference in turf color between the medium and high rates of Aquaboost when the plots were irrigated with potable water under the 50% ETo irrigation regime.
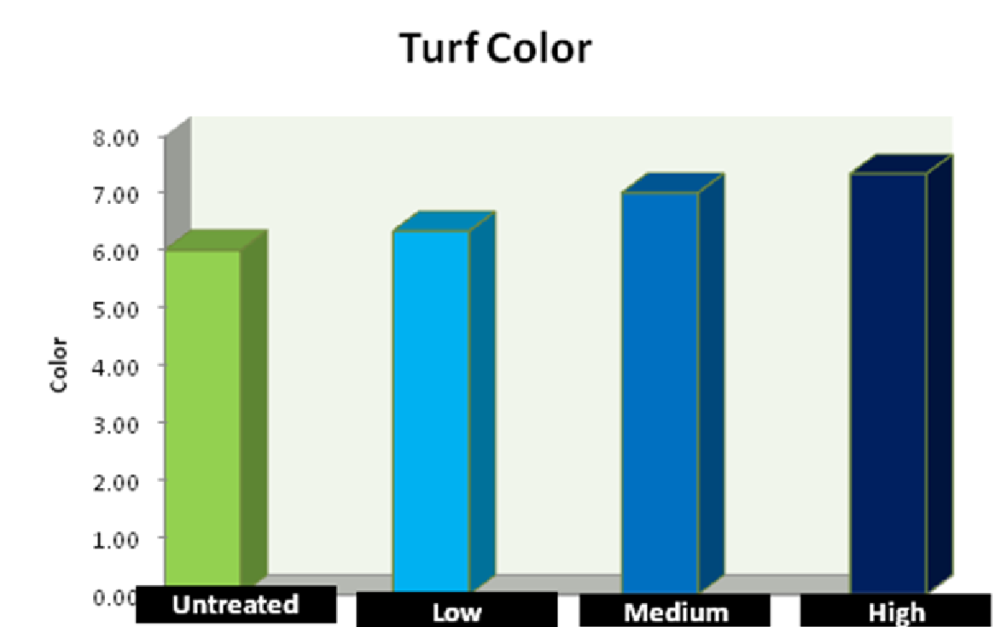
Figure 37. Turf color in the plots irrigated with potable irrigation water throughout the experiment.
Turf Quality
Recycled water
The addition of Aquaboost resulted in higher turf quality compared to the untreated plots. The highest turf quality was observed with the high rate of Aquaboost. There was no significant difference in turf quality between the low and medium rate of Aquaboost treatment.
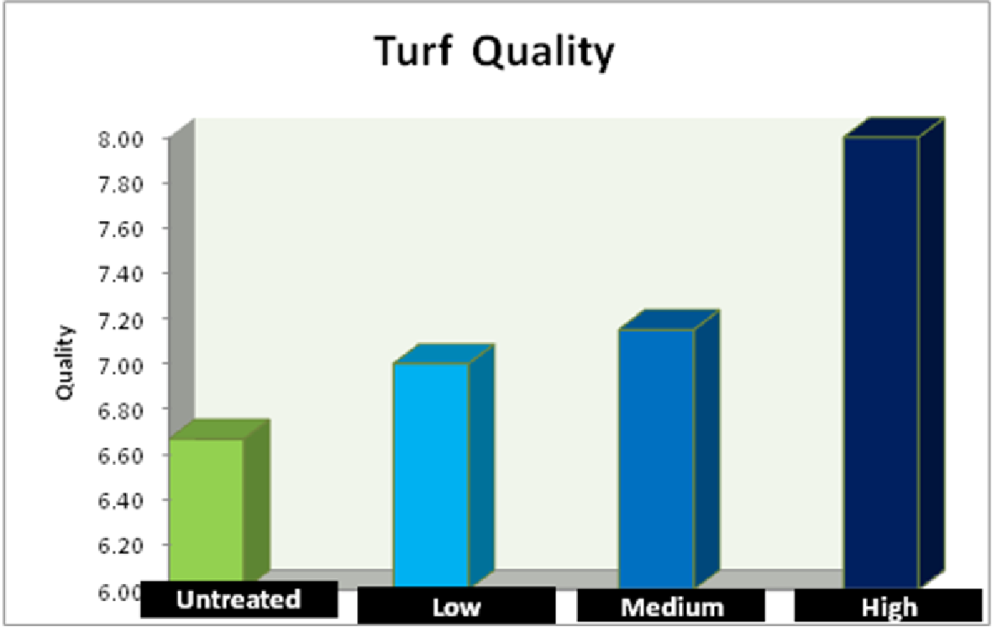
Figure 38. Turf quality in the plots irrigated with recycled irrigation water throughout the experiment. The plots were visually rated on a scale of 1-10, where 1 = brown dead turf and 10 = lush green color.
Potable Water
The addition of Aquaboost resulted in improved turf quality compared to the untreated treatment. There was no difference in turf quality between the low, medium and high rate of Aquaboost treatments.
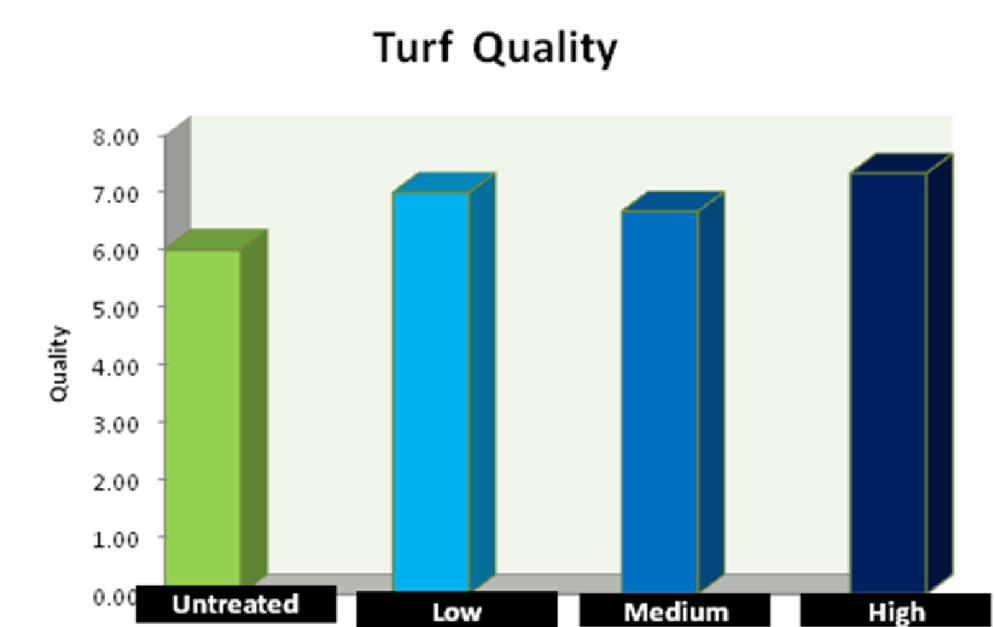
Figure 39. Overall turf quality of the plots irrigated with potable irrigation water. The plots were visually rated on a scale of 1-10, where 1 = brown dead turf and 10 = lush green color.
Normalized Difference Vegetative Index (NDVI)
Recycled Water
The highest normalized difference vegetative index (NDVI) was observed in the highest rate of Aquaboost followed by the medium and the low rate.
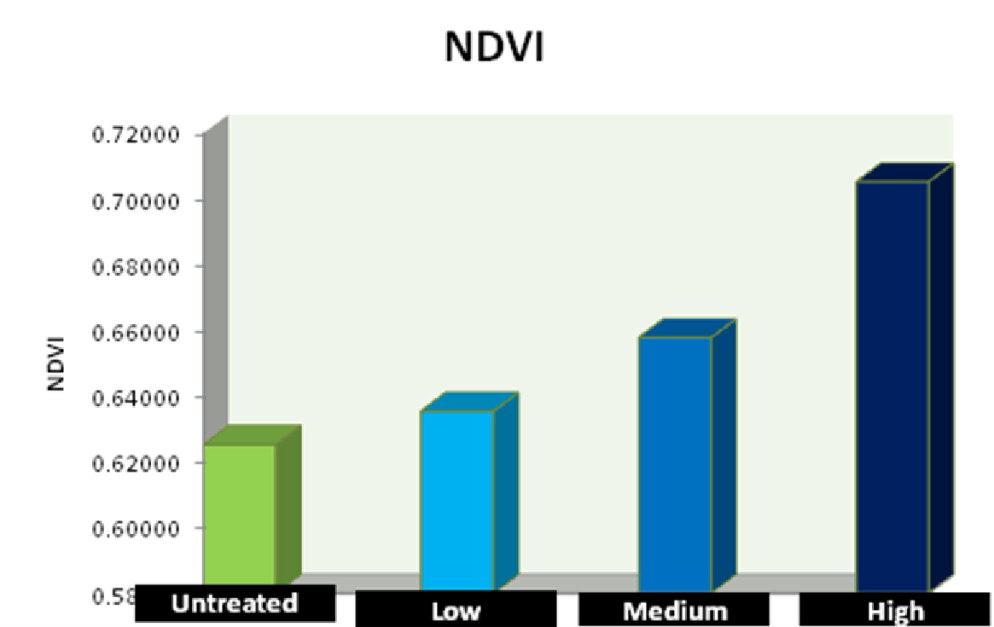
Figure 40. Overall normalized difference vegetation index (NDVI) of the plots irrigated with recycled irrigation water.
Potable Water
The difference between the treatments was not significant in the plots irrigated with potable water. Highest NDVI was observed in the high and medium rate of Aquaboost treatment followed by the low rate of Aquaboost. There was no difference between the low, medium and the high rates of Aquaboost treatments.
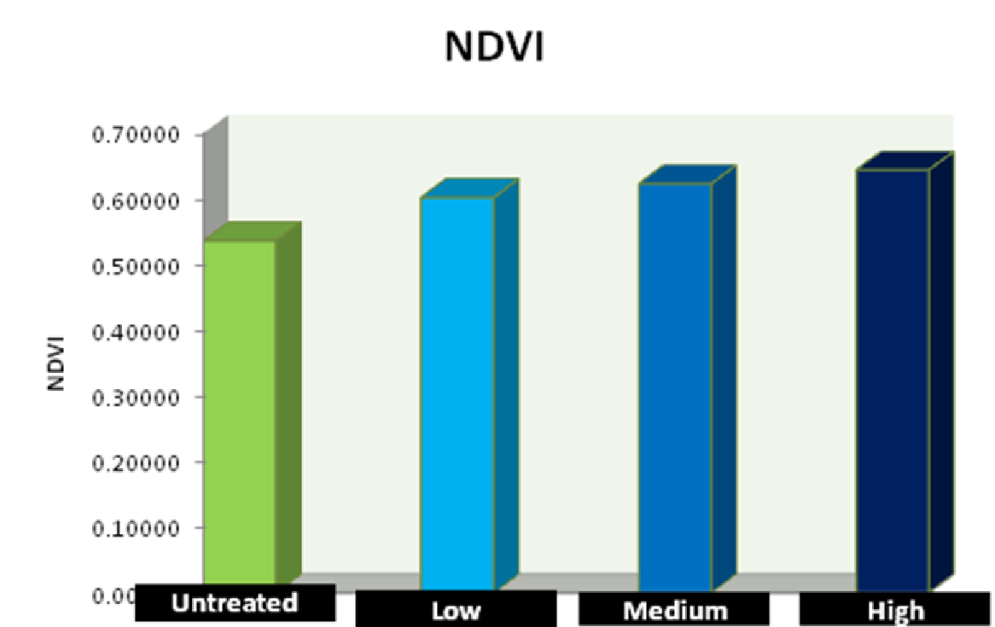
Figure 41. Overall NDVI of the plots irrigated with potable irrigation water.
RED/NIR
Recycled Water
Lowest Red/NIR was observed in the high and medium rate of Aquaboost treatment followed by the low rate of Aquaboost and untreated plots. There was no significant difference between the medium and the high rate of Aquaboost treatments.
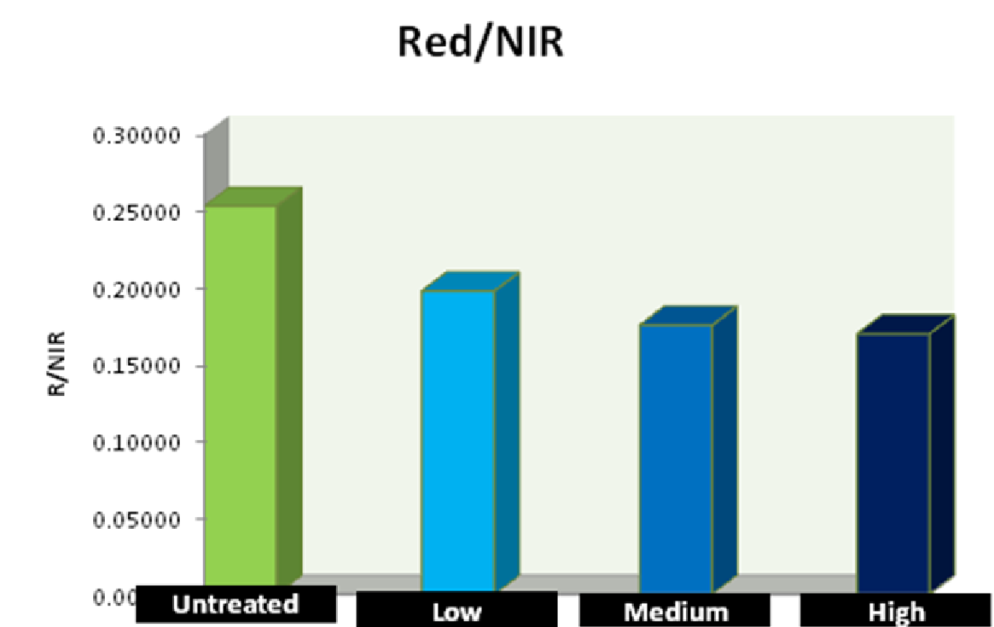
Figure 42. Overall red/near infra red (R/NIR) value for the plots irrigated with recycled water.
Potable Water
The difference in red/NIR ratio between the treatments was not significant. The lowest ratio of red/NIR was observed in the lowest rate of Aquaboost followed by the medium and the low rate of Aquaboost.
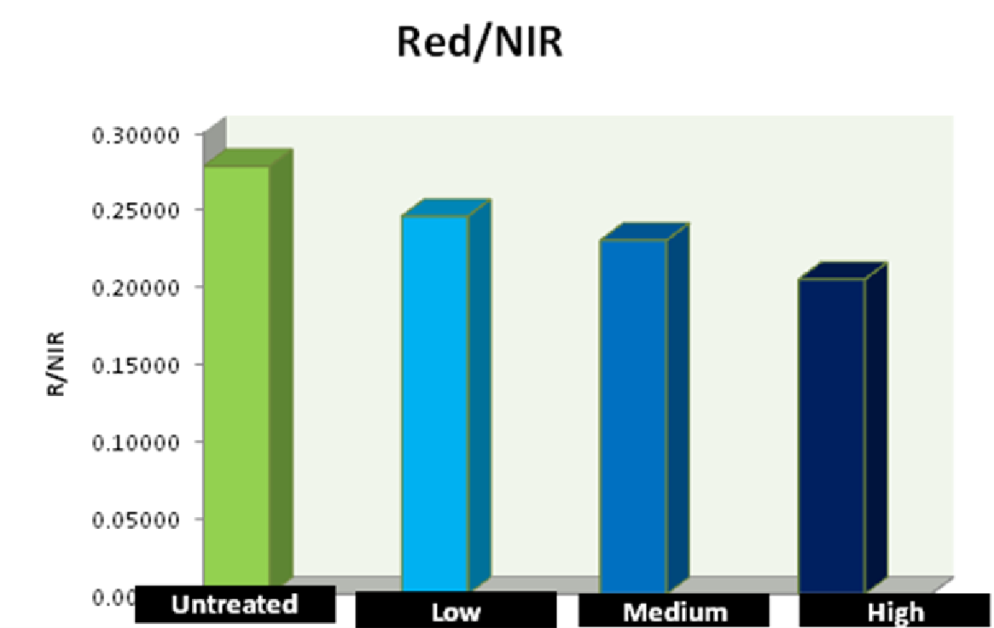
Figure 43. Overall red/near infra red (R/NIR) value for the plots irrigated with potable water.
Volumetric Moisture Content (VMC)
Recycled Water
The volumetric moisture content (VMC) at 4 inches under the soil surface indicated that the highest VMC was observed with the high rate followed by the medium and low rate of Aquaboost.
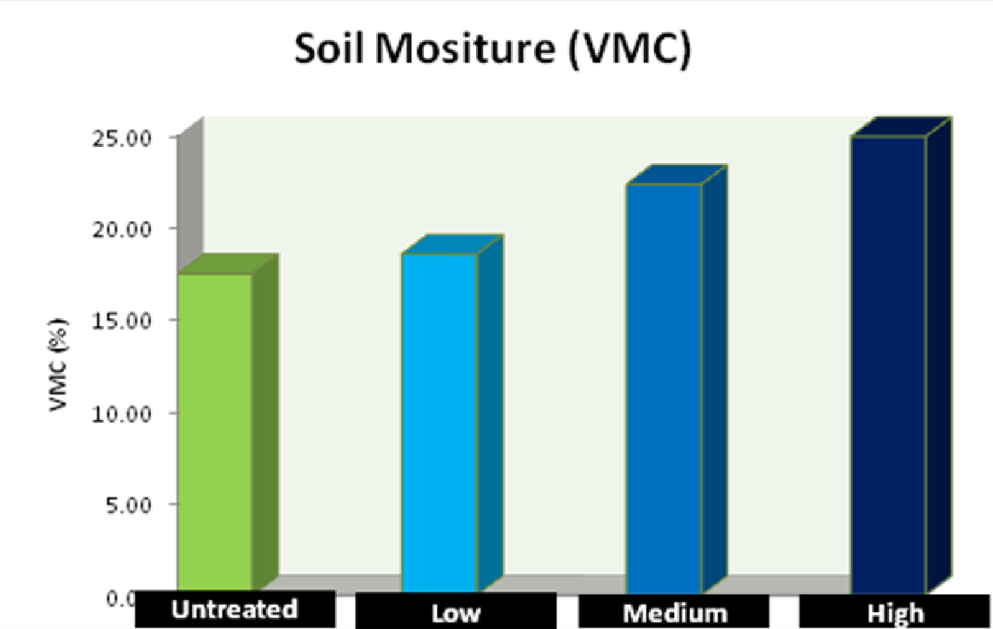
Figure 44. Overall volumetric soil moisture content (VMC) for the treatments irrigated with recycled water.
Potable Water
Highest VMC was observed with the high rate of Aquaboost. There was no difference between the medium and low rate of Aquaboost treatment.
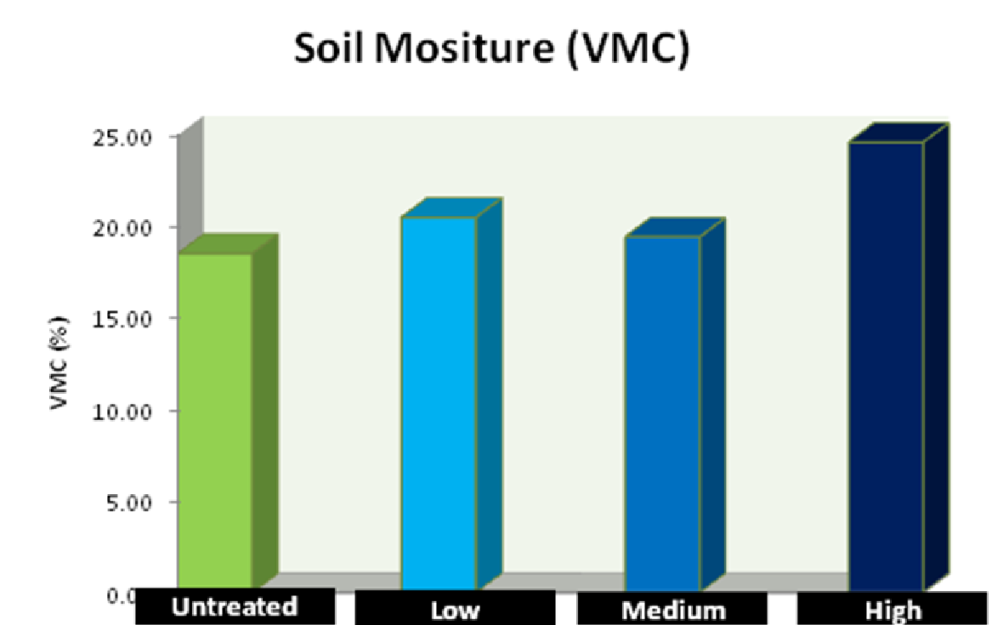
Figure 45. Overall volumetric soil moisture content (VMC) for the treatments irrigated with potable water.
25% ETo
During the month of September 2009 the irrigation system was set to deliver 25% of the ETo replacement. Hence these treatments were actually saving 75% of the irrigation water with respect to the ETo replacement values. Taking the crop coefficient of bermudagrass as 0.75 the irrigation regime of 75% ETo was optimum amount of irrigation that should be applied to bermudagrass maintained under southern California growing conditions. Hence the 25% ETo irrigation was actually 50% less than optimum irrigation regime for bermudagrass maintained under arid growing conditions of southern California.
ETc= Crop coefficient x ETo
Turf Color
Recycled Water
All the plots which received Aquaboost had higher turf color compared to the untreated plots. Highest color was observed with the high rate of Aquaboost followed by the medium and low rate of Aquaboost treatments applied with recycled water irrigated plots under the 25 % ETo irrigation regime (Figure 46).
Potable Water
The highest rate of Aquaboost had higher turf color compared to the other treatments. All rates of Aquaboost resulted in higher turf color compared to untreated plots. There was no difference in turf color between the low and the medium rate of Aquaboost treatments.
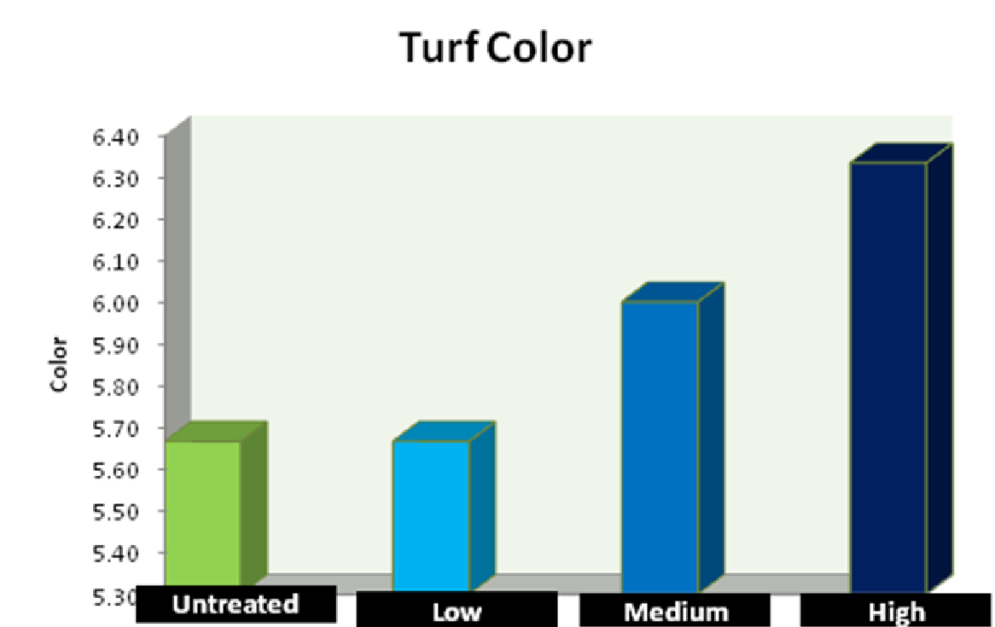
Figure 46. Overall turf color for the treatments irrigated with recycled water.
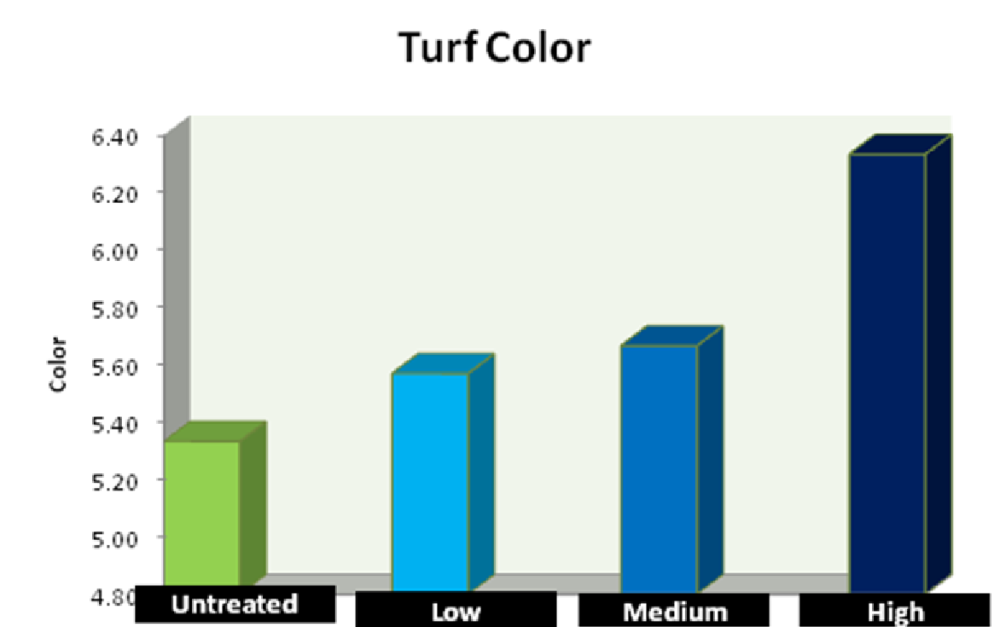
Figure 47. Turf color in the plots irrigated with potable irrigation water throughout the experiment.
Turf Quality
Recycled water
The addition of Aquaboost resulted in higher turf quality compared to the untreated plots. There was no significant difference in turf quality between the low, medium and high rate of Aquaboost treatment.
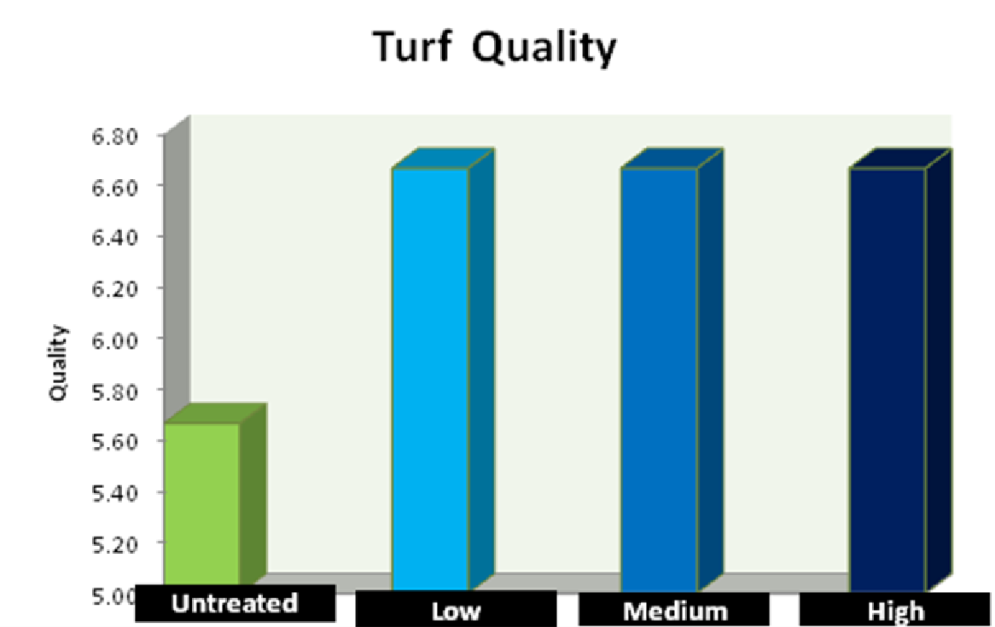
Figure 48. Overall turf quality of the plots irrigated with recycled irrigation water..
Potable Water
The highest rate of Aquaboost had higher turf color compared to the other treatments. There was no difference in turf color between the low and the medium rate of Aquaboost treatments.
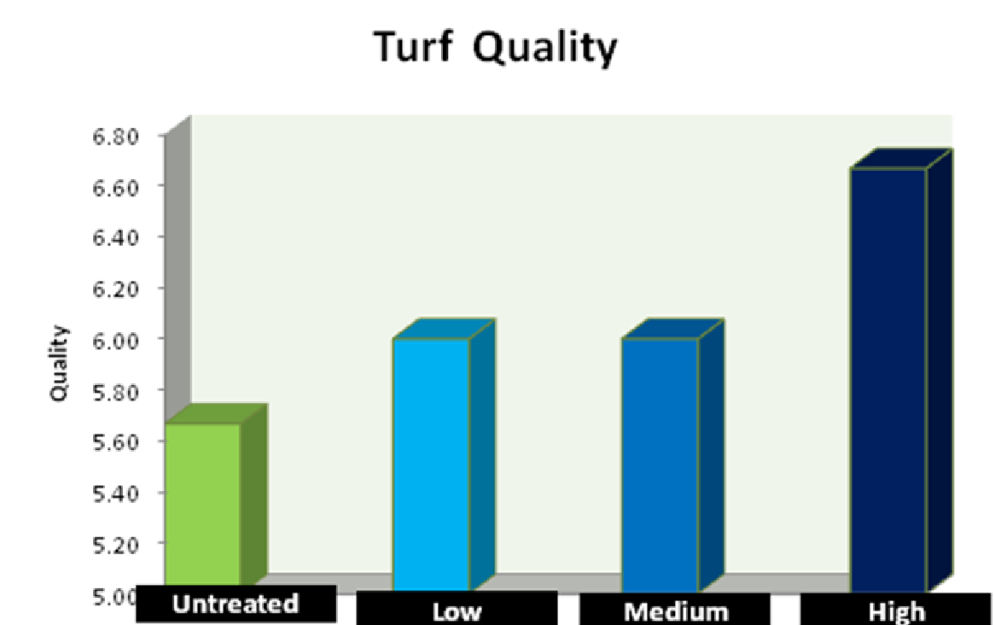
Figure 49. Overall turf quality of the plots irrigated with potable irrigation water. The plots were visually rated on a scale of 1-10, where 1 = brown dead turf and 10 = lush green color.
Normalized Difference Vegetative Index (NDVI)
Recycled Water
The highest normalized difference vegetative index (NDVI) was observed in the highest rate of Aquaboost followed by the medium and the low rate. All the Aquaboost treatments resulted in higher NDVI which indicated higher turf quality in the plots treated with Aquaboost irrigated with recycled water.
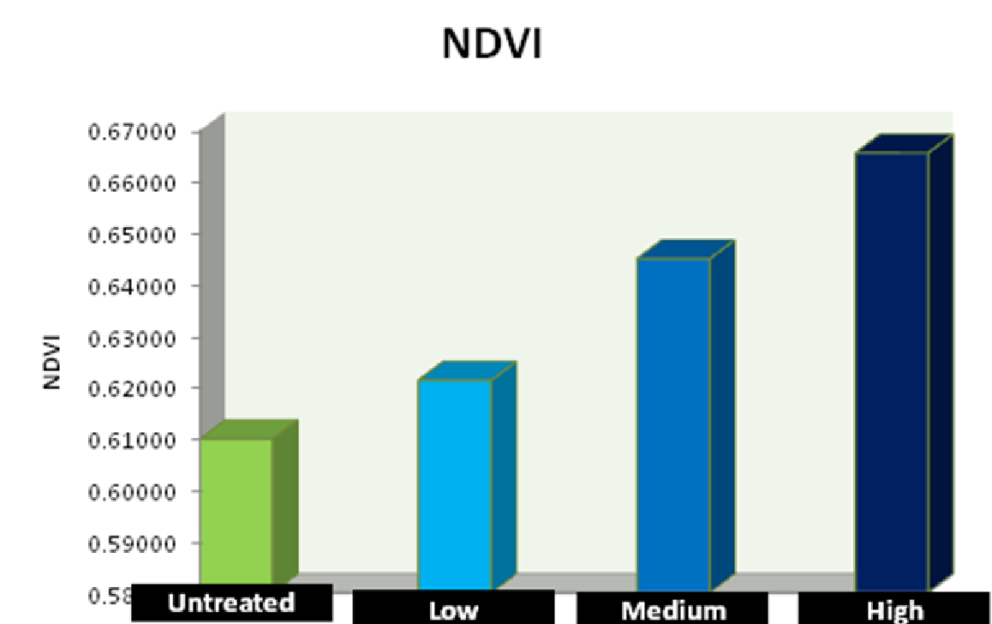
Figure 50. Overall normalized difference vegetation index (NDVI) of the plots irrigated with recycled irrigation water.
Potable Water
The difference between the treatments was highly significant in the plots irrigated with potable water. Highest NDVI was observed in the highest and medium rate of Aquaboost treatment followed by the low rate of Aquaboost. There was no difference between the medium and the high rates of Aquaboost treatments.
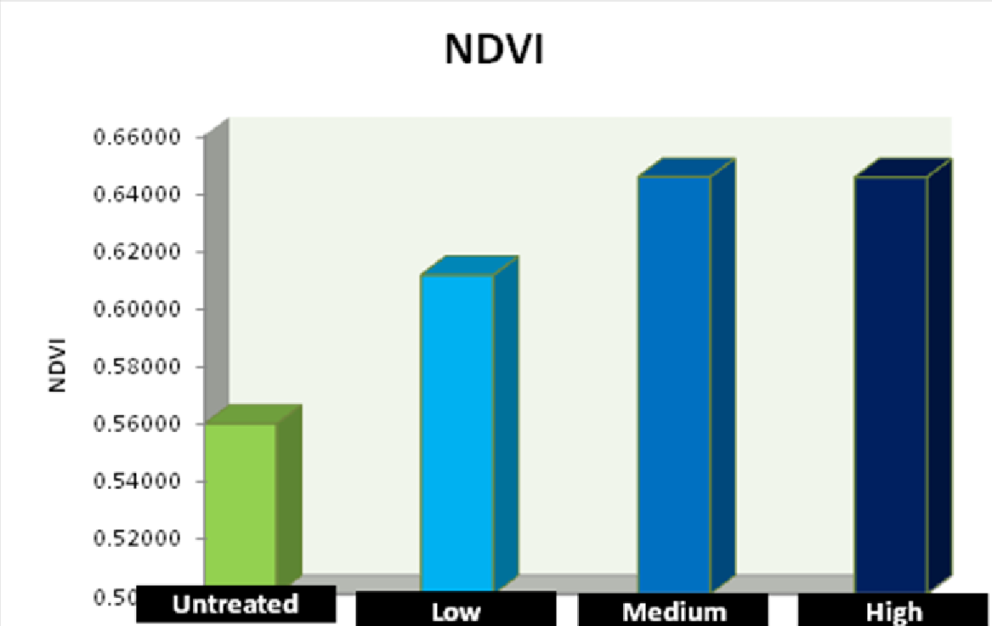
Figure 51. Overall NDVI of the plots irrigated with potable irrigation water.
RED/NIR
Recycled Water
The difference in ratio of Red/NIR for all the treatments was significant for the plots irrigated with recycled water. The lowest Red/NIR ratio was observed in the high rate of Aquaboost followed by the medium and low rate which indicated that the turf in those plots had the lowest stress and was healthier than the other treatments.
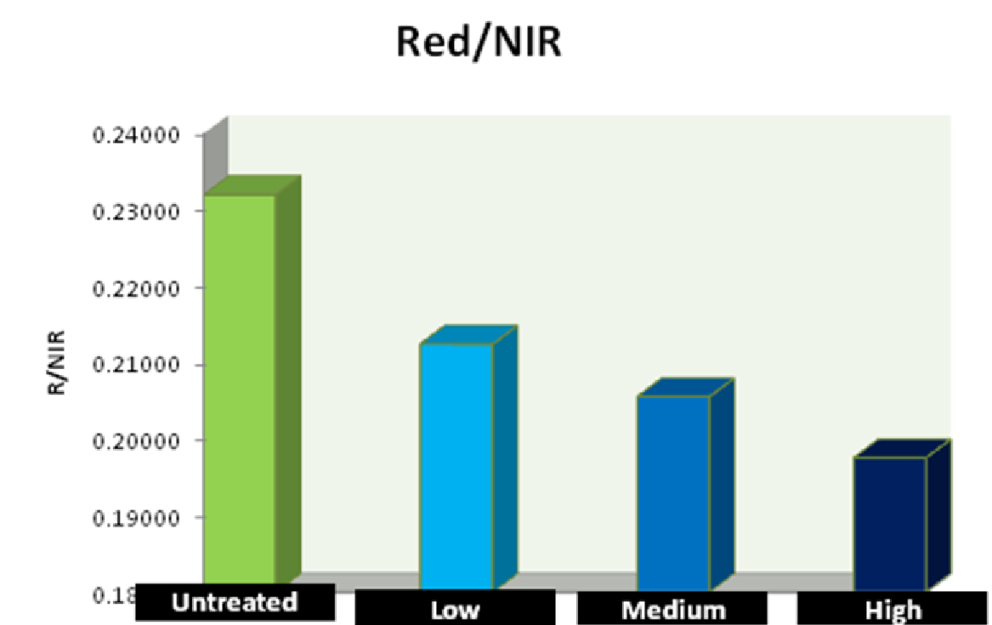
Figure 52. Overall red/near infra red (R/NIR) value for the plots irrigated with recycled water.
Potable Water
The ratio of red/NIR was lowest in the high rate of Aquaboost followed by the medium and low rate. The difference in red/NIR ratio between the treatments for the medium and low rates was not significant.
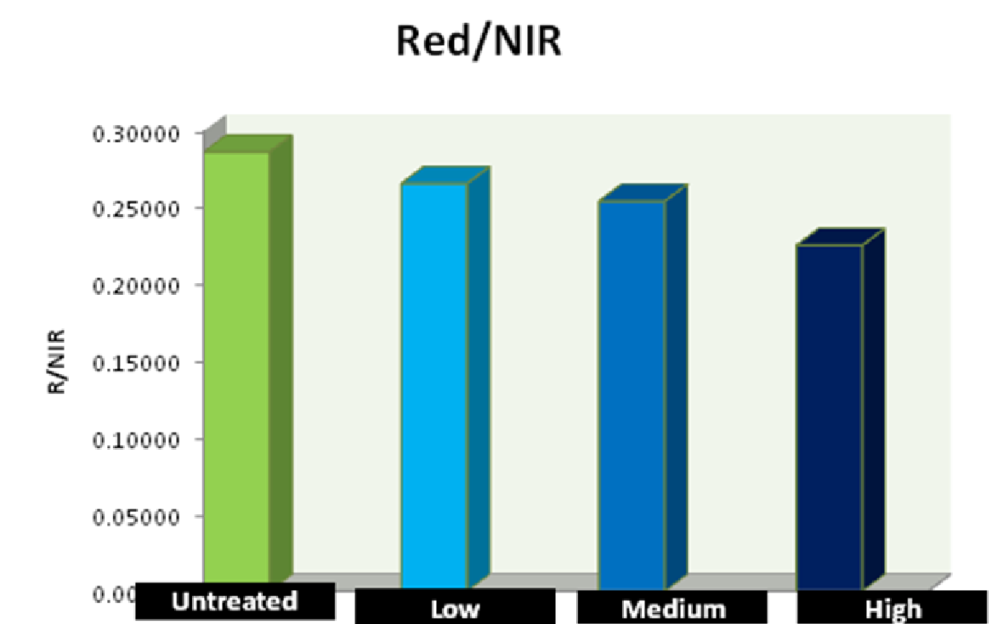
Figure 53. Overall red/near infra red (R/NIR) value for the plots irrigated with potable water.
Volumetric Moisture Content (VMC)
Recycled Water
The volumetric moisture content (VMC) at 4 inches under the soil surface indicated that the highest VMC was observed in the high rate of Aquaboost followed by medium and low rate. There was no significant difference between the medium and low rate of Aquaboost treatments.
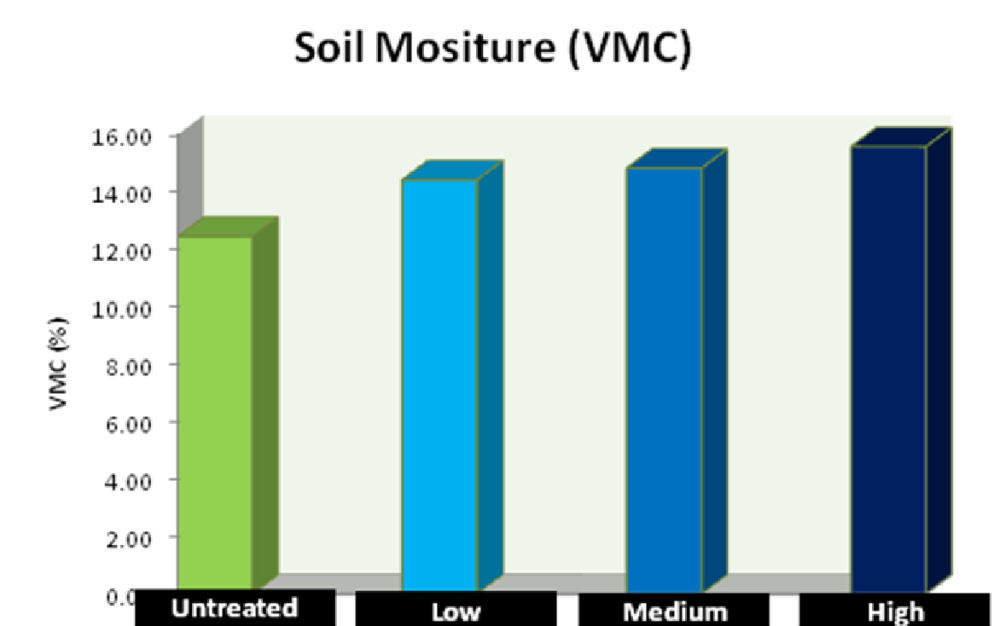
Figure 54. Overall volumetric soil moisture content (VMC) for the treatments irrigated with recycled water.
Potable Water
The difference in VMC between the treatments was significant in the potable water irrigated plots. Highest VMC was observed in the high rate of Aquaboost treatment followed by the medium and low rate. There was no significant difference between the medium and low rate of Aquaboost treatments.
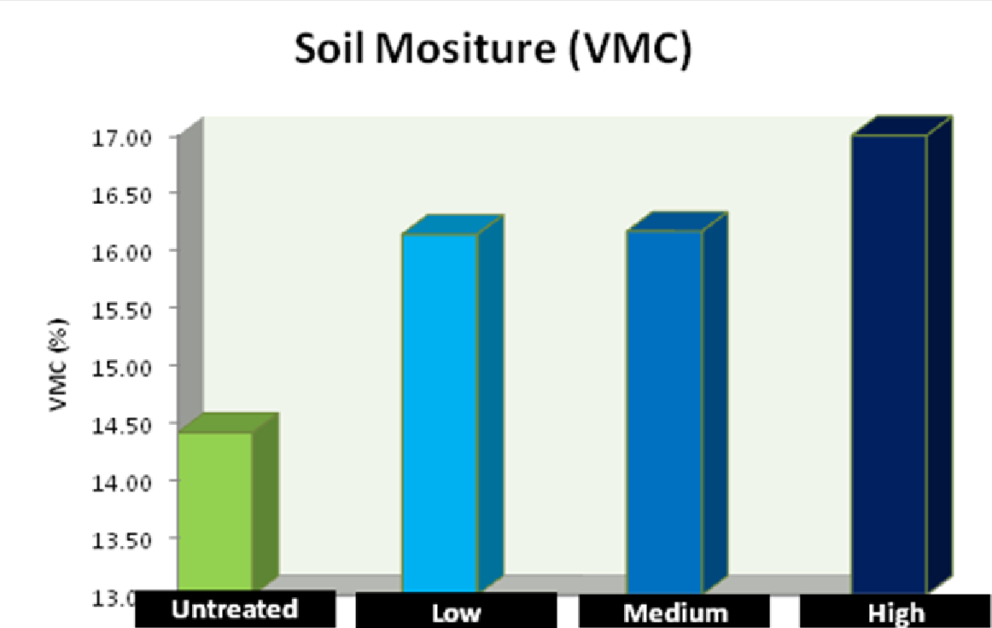
Figure 54. Overall volumetric soil moisture content (VMC) for the treatments irrigated with recycled water.
Conclusion
Overall the application of Aquaboost resulted in improved turf color, quality and reduced stress on bermudagrass maintained under golf course fairway management practices on a clay loam soil in southern California when the amount of irrigation was limited. Under optimum moisture (75% ETo) or over irrigation (100% ETo) the addition of Aquaboost did not significantly improve turf color, quality, growth and development. Under reduced irrigation practices (67%, 50% and 25% ETo) Aquaboost helped in improving turf color, quality, and reduced stress on the turf which was indicated by the higher NDVI values and lower red/NIR ratios compared to the control plots. Aquaboost applied at the high rate (8,000 ppm) increased volumetric moisture content (VMC) in the soil under reduced irrigation practices. In a heavy soil like the soil in the experiment (clay loam) systematic addition of Aquaboost would help conserve irrigation water by 25% (50% ETo) to 50% (25% ETo) compared to the optimum irrigation regime for bermudagrass maintained under golf course fairways management conditions in southern California without adversely effecting growth and development of the bermudagrass. In lighter textured soils the amount of water that can be conserved will be lesser compared to the results obtained in this study conducted on a heavy textured soil. The crop coefficient of other turf species like tall fescue or Kentucky bluegrass are different than bermudagrass so the amount of water than can be conserved can be calculated from the ETo replacement values by multiplying the crop coefficient values for the turf type. In conclusion Aquaboost can be used as tool to conserve irrigation water without adversely affecting turf physiology. In order to achieve optimum results a programmed systematic approach of injecting Aquaboost into the irrigation lines on a regular basis (1 to 2 week interval) during the actively growing season of the turf species in question should be recommended.
References
Park, D. M., J. L Cisar, D. K. McDermitt, K. E. Williams, J. J. Haydu, and W. P. Miller. 2005. Using red and infrared reflectance and visual observations to monitor turf quality and water stress in surfactant-treated bermudagrass under reduced irrigation. International Turfgrass Society Research Journal 10:115-120.